I squeezed the bag of ice wrapped in the bandanna around my neck and shivered as an ice cold bead of water snaked down my spine. The temperature reading from the shaded sensor clipped to my pack read 106°F.
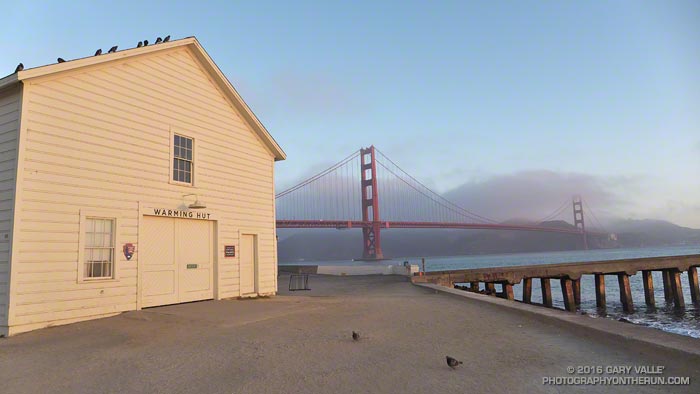
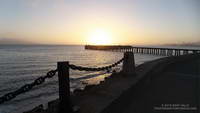
Sunrise on Golden Gate Promenade near Fort Point Pier
That had been at 3:30 Thursday afternoon at Ahmanson Ranch. Earlier that day the “in the sun” temp recorded at the nearby Cheeseboro RAWS had topped out at a blistering 119°F!
This morning, Sunday morning, my AC100 heat training was on hold. The sun had just risen and I was running on the dew-covered sidewalk of the Golden Gate Bridge. The temperature sensor was reading about 54 degrees cooler than at Ahmanson — an almost chilly 52°F.
Not to worry — I would be back running in the 100 degree Ahmanson heat Tuesday.
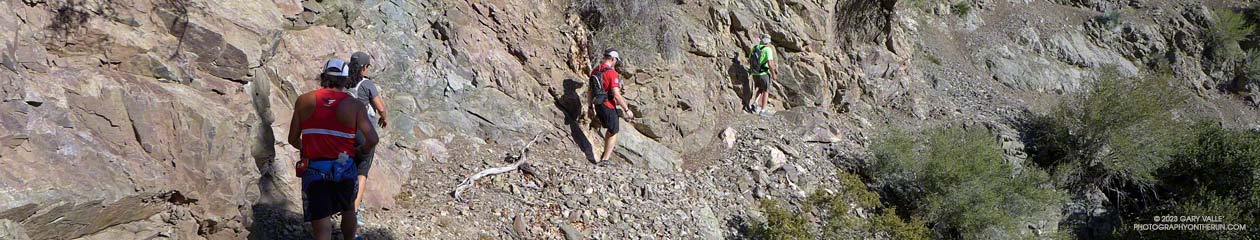
A couple of weekends ago we had cool weather for a 28 mile Angeles Crest 100 training run from Islip Saddle to Chilao Flat. It was a bit windy and chilly at Islip Saddle, but once we were up and over the shoulder of Mt. Williamson the wind settled down and the weather for the remainder of the run was near perfect.
This was the second of four supported AC100 training runs, each covering a different section of the course. These organized runs account for just a tiny fraction of the total mileage a runner does to prepare for this event, and much of the mileage is done on the AC100 course.
Where is the AC100 course? Incorporating segments of iconic trails such as the Pacific Crest Trail, Silver Moccasin Trail and Gabrielino Trail, the AC100 starts in the mountain community of Wrightwood, California and ends in Altadena near JPL, traversing a large part of the San Gabriel Mountains.
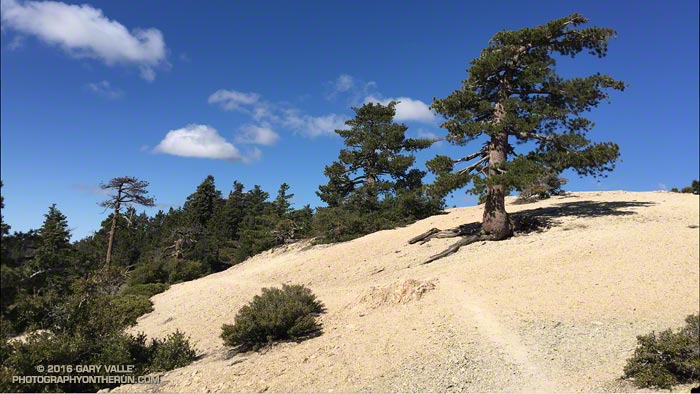
Mountain weather — even Los Angeles County mountain weather — can be extremely varied and changeable. At about mile 18 the AC100 course reaches an elevation of more than 9,200′, near the summit of Mt. Baden-Powell. On the same day temperatures on the course can differ by 50 degrees or more. One section can be inundated by a flash flood while another is bone dry. During a Spring training run it might be 100 in the sun at Echo Mountain, while it is snowing on Baden-Powell.
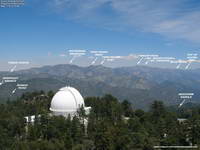
Annotated Mt. Wilson Towercam Image
The Mt. Wilson Towercam is usually pointed in the direction of the Angeles high country. When it is, it provides a great overview of about two-thirds of the AC100 course. The view extends from the top of the Acorn Trail at about mile 4 (in the distance on the far right), along the crest past Mt. Baden-Powell, Throop Peak, Twin Peaks and Waterman Mountain to Three Points at about mile 43. Chilao is hidden from view, but the Charlton Flat area and a section of Edison Road is visible on the left. Newcomb Saddle, at about mile 68, is on the lower right. Here’s an annotated Towercam image that shows the approximate location of these features.
Bill Westphal’s Altadena Weather & Webcam gives a lower elevation view of the San Gabriels, near the AC100 Finish. The view is NE toward the Sunset Ridge Trail and Mt. Lowe Road, around mile 93 or 94. The course goes from the right of the photo to the left, but is mostly hidden from view.
If you are willing to jump through some Java security hoops the Mountain Hardware Live Interactive Cam in Wrightwood is a couple blocks from the AC100 Start. It has views of downtown Wrightwood, Wright Mountain, the Heath Canyon landslide, Blue Ridge and several other locations. I temporarily enabled Java and followed the troubleshooting info linked on the web cam page. I’ve been able to get it to work on a desktop system using Firefox or Internet Explorer. Note that enabling Java and adding non-secure URLs to the Java exceptions list decreases the security of your computer.
Following are several Remote Automated Weather Stations (RAWS) and Weather Underground Personal Weather Stations (PWS) along or near the AC100 course, in order from Start to Finish.
It is important to note that the air temperature given by RAWS stations is the temperature inside a sun-shielded, ventilated enclosure 4-8 feet off the ground. Basically it’s the temperature in light shade. The temperature in full sun can be 15°F higher. I’ve found the “Fuel Temperature” to be a better gage of how hellish it’s going to be on exposed areas of trail. (The Fuel Temperature is the temperature of a ponderosa pine dowel in direct sun.)
Big Pines BPNC1 RAWS (6964′) – Off Hwy 2 near Mountain High Ski Area. Top of Mt. Baden-Powell can be 12+ degrees cooler and much more windy. Was 64°F at 6:54 a.m. for 2015 AC100. Fuel temp at 11:54 a.m. was 92°F.
Chilao CHOC1 RAWS (5450′) – Approximately 1.25 miles WNW of Chilao aid. Fuel temp at 1:53 pm was 95°F for 2015 AC100. Air temp at 6:53 pm was 79°F.
Clear Creek CEKC1 RAWS (3000′) – Approximately 6.8 miles W of Shortcut Aid (~4793′) and 2.9 miles W of Red Box Aid (~4620′). Was 71°F at 8:54 p.m. for 2015 AC100.
Mt. Wilson MWSC1 (5710′) – Approximately 1.5 miles NW of and 780′ above the top of Mt. Wilson Toll Road (~4930′). Compare to JPL 5600′. Was 69°F at midnight for 2015 AC100.
Henninger Flats HNGC1 RAWS (2800′) – Approximately 0.8 miles WSW of Idlehour Aid (~3168′). Marine layer can increase humidity on this section of the course. Was 69-70°F from 4 a.m. to 7 a.m. for 2015 AC100. Fuel temp was 89°F by 11a.m.
Altadena KCAALTAD18 PWS (1214′) – Approximately 0.6 miles S of Finish. For 2015 AC100 temp ranged from 66°F at 2 a.m. to 63°F at sunrise. Temp was 79°F at 9 a.m., 82°F at 11 a.m., and 86°F at 1 p.m. Humidity was high with dew point about 70°F.
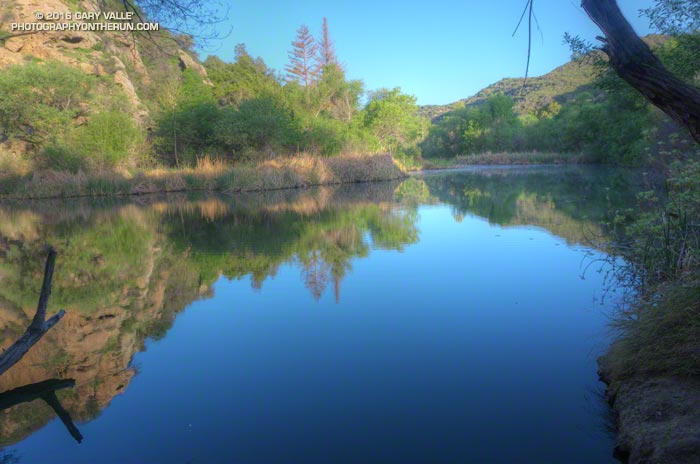
Illuminated by a just-risen sun, Goat Buttes reflected sharply on the lake’s surface. Ducks squabbled near some reeds and a bullfrog’s resonant croaking filled the canyon.
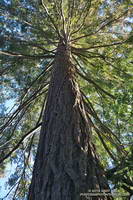
Part way through the Bulldog Loop, I’d paused for a moment at Century Lake in Malibu Creek State Park to enjoy the tranquility of the early morning. I snapped a photo and then noticed something very disturbing. The hundred year old coast redwoods across the lake looked brown.
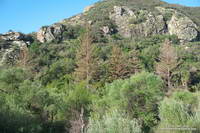
Dying coast redwoods at Century Lake in Malibu Creek State Park
I tried to convince myself it was just the golden hue of the warm morning light, but it wasn’t. From Crags Road I could see at least one tree appeared to be dead, and most of the others were highly-stressed, if not dying. A detour to the other side of the lake on the Forest Trail confirmed the bleak situation.
Dead coast redwood at Century Lake
Although coast redwoods have been planted in several areas of Southern California, they do not occur naturally here. The southernmost stand of naturally-occurring coast redwoods is about 200 miles north of Malibu Creek State Park in the Southern Redwood Botanical Area of Las Padres National Forest.
Redwoods have widespread, but shallow, root systems. Drought and warming temperatures are a worst case scenario for these trees, with the upper layer of soil being moisture-starved and baked.
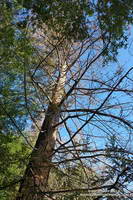
This redwood is in better condition than those along the shore of Century Lake.
Ironically the redwoods closest to the lake appear to be the most severely affected. This tree away from the lake on the Forest Trail appears to be in better shape, but it too is showing signs of stress.
Malibu Creek State Park isn’t the only locale in Southern California where redwoods are dying. According to this May 2015 San Gabriel Valley Tribune article, 15 redwoods were removed from Verdugo Park in Glendale, and redwoods in other areas of Southern California have also been affected.
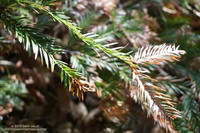
Browning foliage of a coast redwood in Malibu Creek State Park
As mentioned in an earlier post, the 2004 article “What’s up with the redwoods?” by James Downer, discusses a dramatic decline in coast redwoods planted in Ventura County and describes some of the problems that can affect this tree.
Drought and climate impacts are not limited to redwoods in Southern California. Endemic redwoods, particularly those in the southern extent of their range have also been significantly impacted.
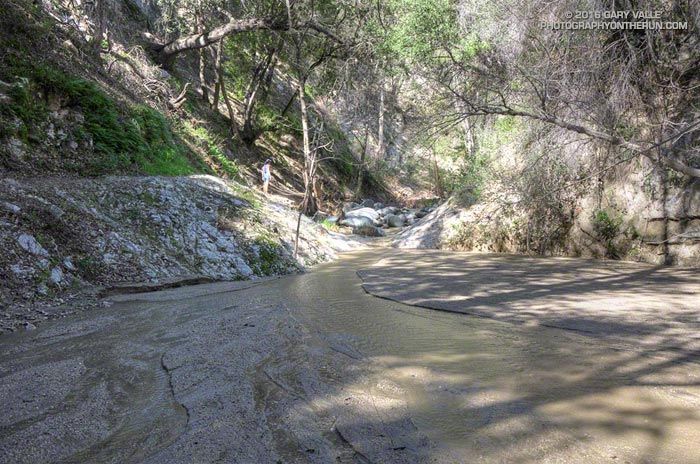
Since kayaking Arroyo Seco with Gary Gunder during the 1997-1998 El Nino, I’ve enjoyed revisiting the many drops and falls along Arroyo Seco when running in the area.
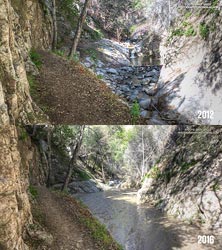
Arroyo Seco Sediment 2012 vs 2016. Click for larger image.
Doing a little sleuthing using Yelp reviews of Switzer Falls, it looks like the creek had low sediment levels in early January 2014, but was heavily silted in mid-March 2014. Based on this, it appears that the initial sedimentation event occurred during the storms of February 26 – March 2, 2014, when nearby Opids Camp recorded 10.95 inches of rain.
The origin of the 2009 Station Fire was in the Arroyo Seco watershed and it was one of the most severely impacted. A question that comes to mind is why did the Arroyo Seco drainage produce such a high rate of stream sedimentation in the February-March 2014 rain event, but not in the very high flows of February 2010 and December 2010, and the moderately high flows of March 2011?
Some of the factors likely include vegetative cover, rainfall rate, recent rainfall history, the soil’s hydrophobicity, the soil support provided by degrading root systems, the magnitude of the peak flow and the shape of the stream discharge curve. Our multi-year drought has been an amplifying factor, further reducing vegetative cover and soil support.
For more information regarding the history of the Arroyo Seco watershed and plans for its rehabilitation see the Arroyo Seco Foundation web site.
Originally posted January 7, 2016 and rewritten to reflect the current rainfall totals for Downtown Los Angeles. Rain season totals have been updated as of March 31.
Based on 1981-2010 climate normals Downtown Los Angeles (USC) receives, on average, 1.04 inches of rain in November, 2.33 inches of rain in December, and 3. 12 inches in January. This past November Los Angeles recorded only 0.01 inch of rain, and in December only 0.57 inch. January rainfall was a few hundredths above normal at 3.17 inches.
The 2015-16 El Nino is one of the three strongest El Ninos in the past 65 years; the other two were 1982-83 and 1997-98. How does the amount of rain we’ve had so far this rainfall year compare to the other two? Is this El Nino failing to produce the expected amount of rainfall in Los Angeles?
On January 7, when this post was originally written, the rain year totals were in the same ballpark for the date as during the 1982-83 and 1997-98 El Ninos. That is no longer the case, and Los Angeles rainfall totals are falling far behind those other big El Ninos.
As of January 31 Downtown Los Angeles (USC) has recorded only 6.97 inches of rain for this rain year, which is 0.47 inch below normal. At this point during the 1982-83 El Nino Los Angeles had already recorded 12.98 inches of rain, and in the 1997-98 El Nino 9.15 inches. (See updates below.)
The good news is that the Sierra snowpack is above average. That helps with the water supply, but not so much with naturally-occurring local groundwater and other drought impacts in Southern California. It does help that the Los Angeles rain year total is nearly normal, but I’m still waiting to see running water in upper Las Virgenes Creek.
Remarkably, as of this morning, the medium range models are forecasting dry weather to predominate over the next 10 days or so and both the GFS and ECMWF show a mega-ridge of high pressure developing over the West Coast this weekend. We’ll see!
Update:
As of March 31 Downtown Los Angeles (USC) has recorded only 9.36 inches of rain for 2015-16 rain year, which is 68.5% of normal. At this point during the 1982-83 El Nino Los Angeles had already recorded 25.72 inches of rain, and in the 1997-98 El Nino 26.89 inches. All the data for the April 1 Sierra Snow Course Measurements are not available yet, but it looks like the snowpack will be around 85% of normal. In 1983 the weighted statewide average snowpack was 227% of normal and in 1998 it was 158% of normal.
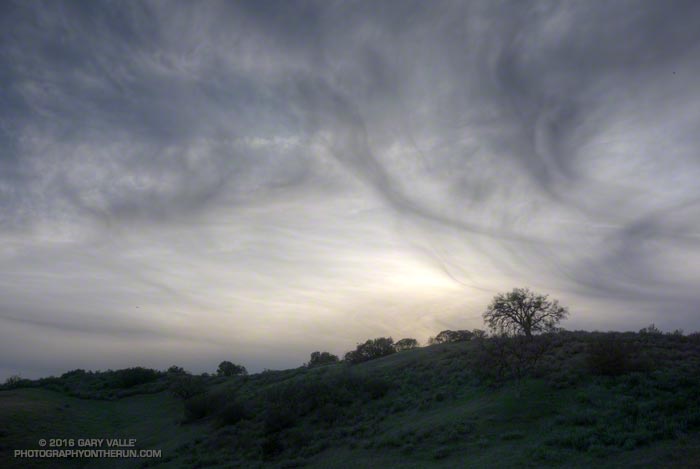
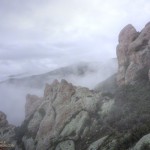
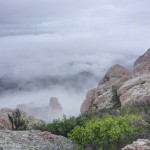
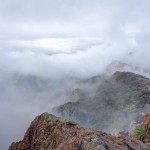
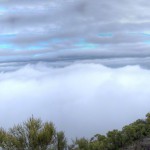
For the most part the upper layer of clouds had been above Boney Mountain. Thin wisps of cloud had clung to the ridges in a couple of places, but the ceiling looked like it was going to remain above the peak.
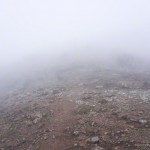
Fog changes the mood and character of a place, particularly a place where airy views and an expansive mindset are the norm. Thoughts turn inward and perceptions more narrowly focused. The big picture becomes entirely virtual.
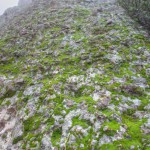
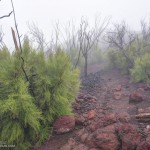
Earlier in the week the area had been drenched by more than two inches of rain. It had been damp overnight and water filled the profusion of irregular pockets covering the volcanic rock. The rock was plastered with a patchwork of bright green moss and gray-green lichen. Saturated with water, the moss was slippery as ice. I climbed with extra care, especially on the steeper sections.
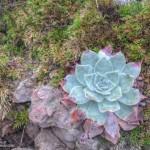
Where soil collected on tiered steps, obovate leaves of shooting-star and other annuals sprouted, presaging a show of the purple and yellow wildflowers. Chalk liveforever relished the moisture, its drought-scarred leaves rehydrating and recovering.
Higher on the ridge the intricate green foliage of red shanks, still recovering from the 2013 Springs Fire, was heavily-beaded with water. Brushing against it was like being sprayed with ice-cold water.
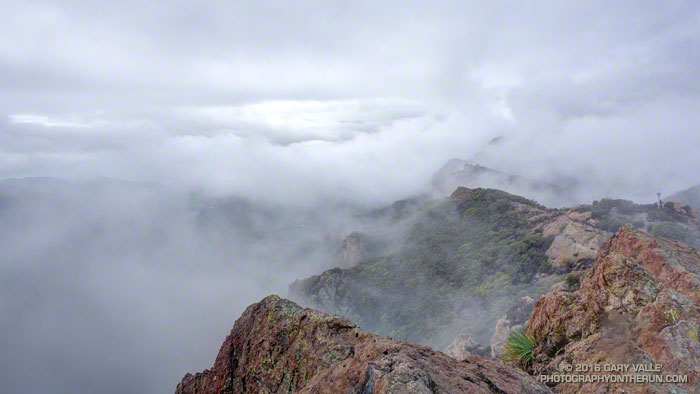
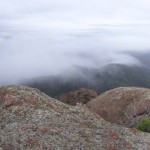
I remained immersed in cloud all the way up the Western Ridge, past Tri Peaks and over to Sandstone Peak, and didn’t climb above them until near the summit of Sandstone Peak.
A few photos from the climb and run are below. Click an image for more info and to display the image full-size.