Category Archives: weather

Winter Green

Greening hill at Ahmanson Ranch -- now Upper Las Virgenes Canyon Open Space Preserve.

It’s about time — all the rain in Southern California is finally turning our hills green! Last year the hills of East Las Virgenes Canyon were sun bleached and rain starved.

According to preliminary NWS data, Downtown Los Angeles (USC) recorded measurable rain on each day from January 21 to January 28, 2008. Based on this NWS ranking for 1921-2006, this puts this eight day period in the top six of the station’s wettest streaks from 1921-2007.

So far this water year Downtown Los Angeles has recorded 11.73 inches of rain, which is 4.77 inches above normal. Last year on this date Los Angeles had recorded only 1.5 inches of rain. Even if Los Angeles were to receive no rain through the entire month of February (not likely), we would still go into the month of March ahead of normal.

The photograph is from a muddy run at Ahmanson Ranch — now Upper Las Virgenes Canyon Open Space Preserve.

Rainy Days on Rocky Peak Road

Stormy view of Simi Valley, California, from Rocky Peak Road.

Ran Rocky Peak road both days last weekend. Saturday’s outing was a 7.3 mile rainy day run out to the Chumash Trail junction and back. Sunday’s was a little longer, about 9.3 miles — past the Chumash Trail junction to the highpoint on the road sometimes referred to as “the fossils.”

The photograph of Simi Valley was taken on Sunday afternoon, just after turning around to head back. The wind was blowing in fitful gusts, and a gray wall of rain loomed to the west. It wasn’t raining yet, but the trailhead at Santa Susana Pass was about 50 minutes away, and there was a feeling things were going to get very wet, very soon.

Over the weekend the west coast was slammed by a series of storms that increased the water year rainfall total at Downtown Los Angeles to an inch above normal and the Sierra snow pack from 60% of normal to over 100%.

So far this rain season, Southern California has dodged a La Nina bullet. This AHPS Precipitation Analysis for the water year indicates much of the area has received near normal to above normal precipitation.

Will Southern California rainfall remain near normal? The Climate Prediction Center’s precipitation outlook for Jan-Feb-Mar (issued Dec. 20), the ERSL/PSD Nov-Mar La Nina precipitation composite, and most other longer range forecast tools say no.

On the other hand… the base state of the atmospheric circulation remains more or less what it has been the past several months, so it doesn’t seem unreasonable to suggest that our pattern of near normal rainfall might continue.

The current NWS 6-10 day and 8-14 day precipitation outlooks project below normal for Southern California, but there are some hints that a system with a lower latitude track could affect the area near the end of the 14 day period. We’ll see!

Note: The ESRL/PSD Composite ENSO plots page was updated yesterday to correct an issue that resulted in the wrong set of years being used for its Winter La Nina composites. As a result the La Nina composite precipitation map in this post is drier in coastal Southern California than in the map originally published in the post Southern California 2007-2008 Winter Precipitation Outlook.

Laguna Peak, La Jolla Valley, and the Channel Islands

Laguna Peak, La Jolla Valley, and the Channel Islands (Anacapa and Santa Cruz) from Boney Mountain.

Wow, it was windy! I was on an exposed ridge between Tri-Peaks and Big Dome, getting pushed around by a unrelenting offshore wind, trying to keep my footing, and take a few photos. About the time I was traversing the ridge, Laguna Peak — the peak in the photograph with all the communications equipment on its summit– recorded a gust of 67 mph.

But this is a mere breeze by Laguna Peak standards. A communication facility operated by the U.S. Navy, the weather station has recorded hurricane force winds on numerous occasions. Several of the wind events listed in the NWS document A History of Significant Weather Events in Southern California reference Laguna Peak. In March of 1991 a gust of 125 mph was recorded at the peak.

Update 12/25/07. Merry Christmas! This morning, about 6:15, Laguna Peak recorded a wind gust of 91.8 mph and several gusts in excess of 85 mph. Between 10:00 a.m. and 11:30 a.m. several gusts over 90 mph were recorded, including one measured at 91.9 mph.

La Jolla Valley is the small valley just below Laguna Peak. Isolated and scenic, it is a “must do” hike or run that can be accessed from the Ray Miller trailhead on PCH, or from Big Sycamore Canyon.

The peak on the left in this wider 16:9 format view is Mugu Peak. Its summit overlooks Pt. Mugu and is a relatively short side trip from the Mugu Trail.

Offshore, two of the Channel Islands can be seen — Anacapa (left) and Santa Cruz.

Fox Mountain Frost

Hollow columnar hoarfrost deposited on leaves and twigs on Fox Mountain in the San Gabriel Mountains, near Los Angeles.

When I see crystals of hoar frost sparkle in the Winter sun it triggers a child-like awe. On Sunday’s Condor Peak Trail Run, several sections of trail glittered as we ran into a low morning sun. On the cold east face of Fox Mountain, a fine, needle-like frost coated the edges and surfaces of leaves and twigs that had collected in pockets on the steep slope.

Digitally magnifying a small section of a 10 Mp image revealed that the frost is comprised of  hollow columns, and further magnification shows that the columns are hexagonal, with lengthwise facets.

This type  of frost – hollow columnar hoarfrost – is described in STUDIES OF FROST AND ICE CRYSTALS by W.A. Bentley, in the Monthly Weather Review, Volume 35, Issue 9 (September 1907), pp. 397-403. Here is an excerpt:

“When formed in the open, they are essentially mild-weather types. They are most common to early autumn and late spring, and the hoarfrost that collects upon the plants and grasses during the so-called destructive frosts at those dates is almost invariably of this type. Hoarfrost deposits of this character form in the open during calm, clear nights when the surface air temperatures range from 56 degrees to 40 degrees at nightfall, and from 33 degrees to 25 degrees during the latter part of the night or early morning.”

Here is a graph of weather data recorded by the Mill Creek (ANF) RAWS on December 1 and December 2. The elevation of the station is 3510′ and it is about 8.5 miles from Fox Mountain (5033′). Parameters graphed are the hourly average wind speed, air temperature, fuel temperature, relative humidity, and dew point.

At Mill Creek the fuel temperature dropped below the frost point at 10:00 p.m Saturday, and did not exceed the frost point again until 8:00 a.m Sunday. For a 5 hour period from 2:00 a.m. to 7:00 a.m. the mean air temperature was 30°F-31°F and the fuel temperature was 22°F-23°F — suggesting strong radiative cooling. Similar conditions probably produced the frost on Fox Mountain.

Racing the Sun

Sunset at Ahmanson Ranch.

Racing the sun,
Waiting for rain,
Listening to a meadowlark sing.

From a run at Ahmanson Ranch — now Upper Las Virgenes Canyon Open Space Preserve. Here’s a larger view of the full 16:9 frame.

For an update on this Winter’s austere outlook for rain, see my November 29 Weathernotes.

Southern California 2007-2008 Winter Precipitation Outlook

New grass sprouting amid oaks at Sage Ranch on October 1, 2007

Updated January 10, 2008. The ESRL-PSD Composite ENSO plots page was updated today to correct an issue that resulted in the wrong set of years being used for its Winter La Nina composites. As a result the La Nina composite precipitation map in this post has been updated.

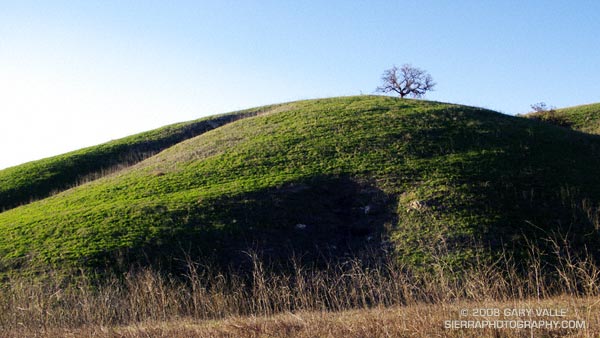
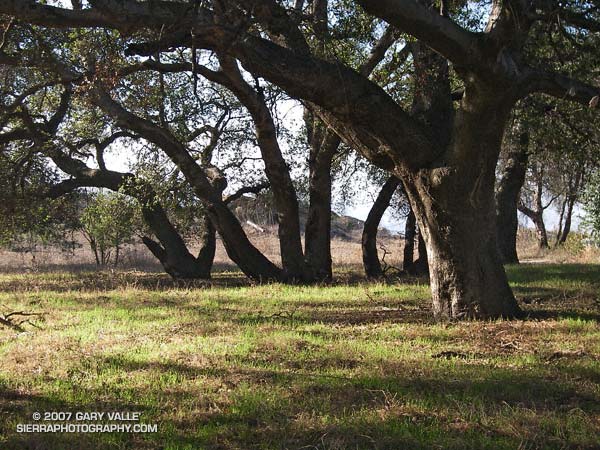
Grasses sprouting as a result of our record setting September rainstorm have brushed our sun parched hills, fields, and woodlands with pleasing hints of green. Whether these areas will remain green depends on how much rain we receive this Fall and Winter.

According to the Climate Prediction Center’s Weekly ENSO Update, issued October 1, La Niña conditions are present across the tropical Pacific and are likely to persist through early 2008. As a result, several longer range U.S. precipitation outlooks are similar to this Nov-Dec-Jan Precipitation Outlook, issued September 20 by the CPC.

The precipitation pattern projected for the western U.S. is typical of a La Niña, with an increased chance of higher than normal precipitation in the Pacific northwest and an increased chance of lower than normal precipitation in the southwest.

The September 20 CPC outlook indicates an “equal chance” of below normal, near normal, or above normal precipitation in the Los Angeles area. However, the La Niña has strengthened recently, so the next precipitation outlook may reflect a more pessimistic projection of Los Angeles area rainfall.

As mentioned above, the ESRL-PSD Composite ENSO plots page was updated today to correct an issue that resulted in the wrong set of years being used for its Winter La Nina composites. This updated precipitation map shows the mean Nov-Mar precipitation for the U.S. during 9 La Niña events from 1948 to the present. Note that the average La Niña rainfall indicated for coastal Southern California is in the 7.0-10.5 inch range, rather than the  10-15 inch range previously indicated in the ESRL-PSD graphic.

The two driest water years recorded in Los Angeles since 1877 have occurred in the last seven years. During the most recent, from Jul 2006 to June 2007, downtown Los Angeles (USC) measured only 3.21 inches of rain. In that context 10-15 inches sounds quite wet! We’ll see.

The photograph of new grass sprouting amid oaks is from a run at Sage Ranch on October 1, 2007.