Category Archives: weather|el nino

Downtown Los Angeles Rainfall Surpasses Normal Rain Year Total

Rainbow at Ahmanson Ranch a few months after the Woolsey Fire.

Yesterday’s atmospheric river event increased the rainfall total for Downtown Los Angeles (USC) since July 1 to 15.50 inches, surpassing the normal annual Rain Year total of 14.93 inches. Last year, as of February 14, Los Angeles had only recorded 1.97 inches of rain.

As a result of all the wet weather, we’ve also been much cooler this December – February than last year. Since December 1 the average high at Downtown Los Angeles has been more than 7 degrees cooler than last year.

The Climate Prediction Center has just issued an El Nino Advisory for the presence of weak El Nino conditions in the equatorial Pacific. However, it is the interaction of the ocean and atmosphere that matters, and the atmosphere is behaving as if stronger El Nino conditions are present.

For the date, Los Angeles rainfall is at about 165% of normal and there’s still more than two months left in the rain season. We’ll see if the wet trend continues!

The title photo is from a  recent run at Ahmanson Ranch. This open space area was burned in the November 2018 Woolsey Fire.

Arroyo Seco Sedimentation

Sedimentation on Arroyo Seco upstream of Bear Creek

Since kayaking Arroyo Seco with Gary Gunder during the 1997-1998 El Nino, I’ve enjoyed revisiting the many drops and falls along Arroyo Seco when running in the area.

When we did the Bear Canyon loop a couple of weeks ago, I was amazed to see many of Arroyo Seco’s stream features were nearly filled in with sediment. This image comparison shows a drop below Switzer Falls in March 2012 and in March 2016.

Arroyo Seco Sediment 2012 vs 2016.
Arroyo Seco Sediment 2012 vs 2016. Click for larger image.

Doing a little sleuthing using Yelp reviews of Switzer Falls, it looks like the creek had low sediment levels in early January 2014, but was heavily silted in mid-March 2014. Based on this, it appears that the initial sedimentation event occurred during the  storms of February 26 – March 2, 2014, when nearby Opids Camp recorded 10.95 inches of rain.

The origin of the 2009 Station Fire was in the Arroyo Seco watershed and it was one of the most severely impacted. A question that comes to mind is why did the Arroyo Seco drainage produce such a high rate of stream sedimentation in the February-March 2014 rain event, but not in the very high flows of February 2010 and December 2010, and the moderately high flows of March 2011?

Some of the factors likely include vegetative cover, rainfall rate, recent rainfall history, the soil’s hydrophobicity, the soil support provided by degrading root systems, the magnitude of the peak flow and the shape of the stream discharge curve. Our multi-year drought has been an amplifying factor, further reducing vegetative cover and soil support.

For more information regarding the history of the Arroyo Seco watershed and plans for its rehabilitation see the Arroyo Seco Foundation web site.

Should Los Angeles Have Had More El Nino Rain?

Cirrus clouds

Originally posted January 7, 2016 and rewritten to reflect the current rainfall totals for Downtown Los Angeles. Rain season totals have been updated as of March 31.

Based on 1981-2010 climate normals Downtown Los Angeles (USC) receives, on average, 1.04 inches of rain in November, 2.33 inches of rain in December, and 3. 12 inches in January. This past November Los Angeles recorded only 0.01 inch of rain, and in December only 0.57 inch. January rainfall was a few hundredths above normal at 3.17 inches.

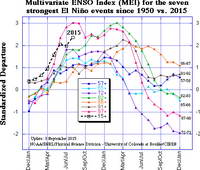
The 2015-16 El Nino is one of the three strongest El Ninos in the past 65 years; the other two were 1982-83 and 1997-98. How does the amount of rain we’ve had so far this rainfall year compare to the other two? Is this El Nino failing to produce the expected amount of rainfall in Los Angeles?

On January 7, when this post  was originally written, the rain year totals were in the same ballpark for the date as during the 1982-83 and 1997-98 El Ninos. That is no longer the case, and Los Angeles rainfall totals are falling far behind those other big El Ninos.

As of January 31 Downtown Los Angeles (USC) has recorded only 6.97 inches of rain for this rain year, which is 0.47 inch below normal. At this point during the 1982-83 El Nino Los Angeles had already recorded 12.98 inches of rain, and in the 1997-98 El Nino 9.15 inches. (See updates below.)

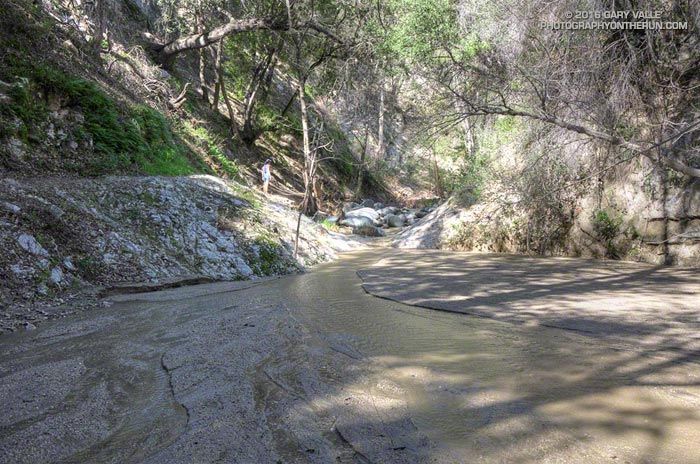
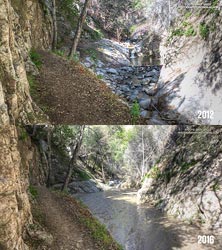
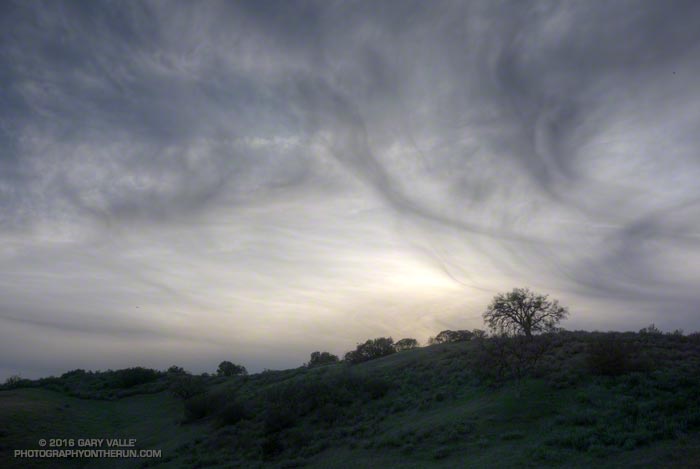
The good news is that the Sierra snowpack is above average. That helps with the water supply, but not so much with naturally-occurring local groundwater and other drought impacts in Southern California. It does help that the Los Angeles rain year total is nearly normal, but I’m still waiting to see running water in upper Las Virgenes Creek.

Remarkably, as of this morning, the medium range models are forecasting dry weather to predominate over the next 10 days or so and both the GFS and ECMWF show a mega-ridge of high pressure developing over the West Coast this weekend.  We’ll see!

Update:

As of March 31 Downtown Los Angeles (USC) has recorded only 9.36 inches of rain for 2015-16 rain year, which is 68.5% of normal. At this point during the 1982-83 El Nino Los Angeles had already recorded 25.72 inches of rain, and in the 1997-98 El Nino 26.89 inches. All the data for the April 1 Sierra Snow Course Measurements are not available yet, but it looks like the snowpack will be around 85% of normal. In 1983 the weighted statewide average snowpack was 227% of normal and in 1998 it was 158% of normal.

Waiting for Rain: El Nino and the 2015-16 Southern California Rainfall Year

Thunderstorm over the Santa Monica Mountains

Due in part to El Nino and the Madden-Julian Oscillation (MJO) Southern California jump-started the 2015-16 rain season with above average rainfall in July and September.

Last year the NWS changed the WATER Year to October 1 – September 30, but the RAINFALL Year remains July 1 – June 30, as it’s been for decades.

Below is the monthly tabulation of rainfall for Downtown Los Angeles (USC) for the 2015-16 Rainfall Year, along with what is considered normal for the month.

Downtown Los Angeles Rainfall
Month Rainfall Normal
July 0.38 0.01
August T 0.04
September 2.39 0.24
October 0.45 0.66
November 0.01 1.04

So far this rainfall year Downtown Los Angeles (USC) has recorded 3.23 inches. Even with November as dry as it’s been we’re still more than an inch above normal for the rainfall year — about 1.46 inches above normal as of November 25.

Over the next couple of weeks the medium range models and other tools aren’t especially bullish on our chances for a good, soaking rainstorm in Southern California. Longer term guidance suggests an improving chance of precipitation as December progresses, and above average precipitation in January and February. We’ll see!

The title photo is from November 3. It shows a band of thunderstorms that moved southward across the San Fernando Valley and into the Santa Monica Mountains. The band produced cloud to ground lightning strikes and some heavy showers. Saddle Peak is in the distance on the left. The shower activity in the distance on the right is in the area of Kanan Rd. and the 101 Frwy.

New Leaves on Drought-Stressed Valley Oak

Drought-stressed valley oak sprouting leaves following summer rains in Southern California

Sprouting new leaves as if recovering from a wildfire, this drought-stressed valley oak at Ahmanson Ranch benefited from the unusual amount of rain in Southern California during July and September.

Hilltop valley oak at Ahmanson Ranch, photographed in April 2011, prior to the drought in Southern California
Valley oak at Ahmanson Ranch

Between July 1 and October 1, the Cheeseboro RAWS, located on a hilltop about two miles away, recorded more than two inches of rain.

Here’s what the tree looked like in 2011, before the drought.

Update January 15, 2021. “The Tree” died in the Spring of 2020, when Ahmanson was closed due to COVID-19. Although scorched in the Woolsey Fire, it never recovered from the 2011-2015 drought, and that appears to have been the primary cause of death.

Some related posts: Ahmanson Valley Oaks Battling Drought, It Was So Muddy (Again) That…, A Two Mud Run Summer and Wet Winter Outlook for Southern California

A Two Mud Run Summer and Wet Winter Outlook for Southern California

Mud puddles on Lasky Mesa following record rainfall on September 17, 2015.

Ahmanson Ranch gets notoriously muddy when it rains, but it is exceptionally rare for it to rain enough in the Summer to do a run in the mud. Due in part to a warm Pacific, El Nino and a little boost from the Madden-Julian Oscillation in early July, it’s been a record two mud run Summer at Ahmanson Ranch!

The first mud run day was on July 18, when the Cheeseboro RAWS recorded 1.32 inches of rain. That day I ran in the San Gabriels, where the main issue was thunderstorms.

Mud in upper Las Virgenes Canyon following record rainfall on September 15, 2015.
Muddy Upper Las Virgenes Canyon

Tuesday (September 15) was a different story. It rained hard overnight — more than three-quarters of an inch — and in the afternoon I did one of my standard weekday loops from the Victory Blvd. trailhead — out East Las Virgenes Canyon, through Las Virgenes Canyon, and up the Beast to Lasky Mesa. It felt more like November than September. After running through a particularly muddy section in Las Virgenes Canyon, heavy plates of mud had built-up on my shoes. Normally I would curse, but on this run I just laughed. It was great to be out in the wet and muck.

Western Regional Climate Center map of the percentage of normal precipitation in the West for the period July 1 to September 16, 2015.
WRCC Percent of Normal Precipitation

Both days set rainfall records at Downtown Los Angeles (USC). July 18 was the wettest day in July and July 2015 the wettest July since recordkeeping began in 1877. September 15 set a new rainfall record for the date and was the second wettest day in September on record. To date, September 2015 is the third wettest September on record. The rain year (July 1 to June 30) is off to a great start in Southern California and the 2015 El Nino has continued to strengthen.

Multivariate ENSO Index (MEI) for the seven strongest El Nino events since 1950 vs. 2015.
MEI for Seven Strongest El Ninos Since 1950

Based on the July-August Multivariate ENSO Index (MEI), for the time of year the 2015 El Nino is one of the three strongest El Ninos since 1950. A survey of dynamical and statistical ENSO models by the IRI & CPC suggests continued warming in the central equatorial Pacific with a peak of the temperature anomaly in the Nino 3.4 region in the OND or NDJ season.

The 2015 El Nino is being compared to the “Super” El Ninos of 1997-98, 1982-83 and 1972-73. It’s too early to tell how the 2015 event will stack up against 1997-98 and 1982-83, but it already has exceeded the strength of the 1972-73 event. How might a Super El Nino affect Southern California rainfall? Historically, they have produced some of the wettest rain years on record. Downtown Los Angeles (USC) recorded 31.01 inches of rain in 1997-98 and 31.25 inches in 1982-83.

Climate Preciction Center's Winter Precipitation Outlook for December-January-February 2015-16
CPC Winter Precipitation Outlook

The climate context is different than it was decades ago, but very strong El Ninos are different beasts and rev up the atmosphere in a way that dominates global weather. Assuming the 2015 El Nino maintains (or increases) its strength into November or December, it should produce above average precipitation in Southern California this rain season, and perhaps result in an above average rain year for the southern half of the state. This is reflected in the Climate Prediction Center’s latest round of 3-Month Seasonal Precipitation Outlooks, including the Winter outlook for December, January & February 2015-16. We’ll see!

Related post: July Deluge a Preview of Southern California’s Upcoming Rain Season?