The second of two vigorous upper level lows to batter Southern California this Autumn has pushed the water year rainfall totals for many stations around the area to above normal. Does that mean we’re likely to see the wet weather continue through the 2010-2011 rain season?
![]()
Probably not. Since last Winter, ENSO conditions in the equatorial Pacific have flip-flopped. The Multivariate ENSO Index (MEI) has plunged from the fifth strongest El Nino for Feb/Mar to the strongest La Nina for Aug/Sep. The Aug/Sep value of the MEI is the lowest since Jul/Aug of 1955. Generally, El Nino conditions result in wetter weather in Southern California, and La Nina drier.
A precipitation composite for eight years in which ENSO was transitioning from El Nino or Neutral conditions to La Nina indicates that “on average” the coastal Southern California climate division recorded about 4 to 5 inches less precipitation than normal for the period November through March. The percent of normal water year rainfall recorded at Downtown Los Angeles (USC) ranged from a low of 53% (1988, 8.08″), to a high of 99% (1973, 14.92″). The average rainfall for these years was 77%, or 11.7″.
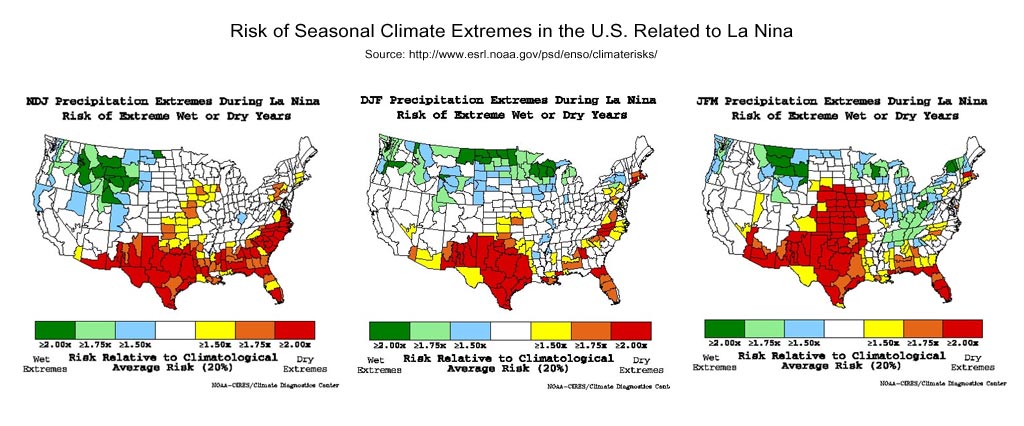
Maps generated using the ESRL/PSD page Risk of Seasonal Climate Extremes in the U.S. Related to ENSO do not indicate a higher than normal risk for an extremely dry rain season in Southern California when La Nina conditions are present.
La Nina composites from CPC’s ENSO Temperature & Precipitation Composites page suggest the period Jan-Feb-Mar may be particularly dry, but this is not reflected in CPC’s official seasonal precipitation forecasts.
CPC’s Three-Month Precipitation Outlooks and NOAA Winter Outlook were updated yesterday. The precipitation outlook for Nov-Dec-Feb in the Coastal Southern California climate division shows equal chances of above average, near average, or below average precipitation. As the rain season progresses, these probabilities become only slightly skewed toward below normal precipitation. The skew becomes more pronounced in Feb-Mar-Apr when the probability of below normal precipitation increases to 45%.
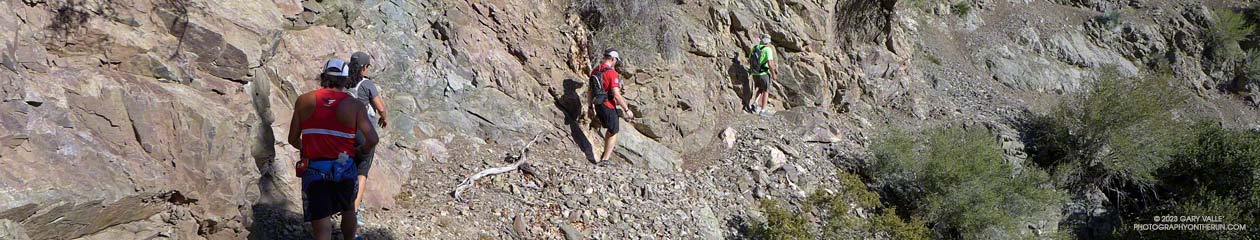
The title photograph is from Sunday’s out and back run from Chatsworth Reservoir to Rocky Peak.