What a difference a week makes! Last week an unseasonably deep upper level low, unusually strong 170+ kt Pacific jet, and associated cold front combined to produce record-setting rainfall and cool temperatures in Southern California. This week high pressure and a weak offshore flow produced triple digit temperatures in some areas and set new high temperature records Wednesday in Downtown Los Angeles, Long Beach and Santa Barbara.
Which pattern is more likely this rain season? Will Southern California tend to be drier like this week, or wetter like last week and last year? Despite last year’s wet rain season, wet La Nina Winters are not the norm. Generally, La Nina conditions result in drier than normal rain seasons in Southern California, and El Nino wetter.
Following a Summer respite La Nina conditions have reemerged in the equatorial Pacific, and appear to be consolidating. Equatorial SST anomalies have continued to decrease and now range from -1.5°C at 100°W to -0.5°C at 170°E. Equatorial Pacific temperature cross sections show substantial subsurface cooling from July 11 to September 11. The Multivariate ENSO Index (MEI) has dropped from -0.5 for July/August to -0.8 for the August/September season. This drops the MEI from a rank of 16th for July/August to 13th for August/September since 1950. This is well within La Nina territory but weaker than last year’s rank of 1st for August/September.

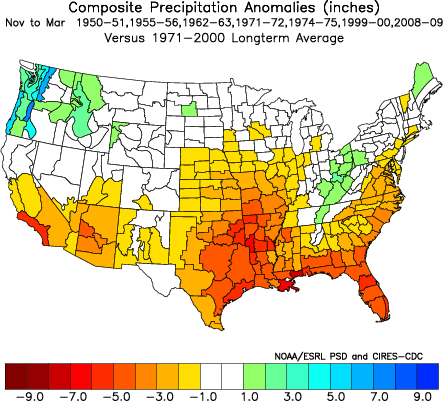
A precipitation composite for seven years* since 1950 in which La Nina conditions persisted or reemerged in the year following a first year La Nina indicates that “on average” the coastal Southern California climate division recorded about 5 to 6 inches less precipitation than normal for the period November through March. The percent of normal water year rainfall recorded at Downtown Los Angeles (USC) ranged from a low of 47% (1971, 7.17″), to a high of 106% (1955, 16.00″). The average rainfall for these years was 70.5%, or 10.7″.
We’ll get the official NOAA/CPC outlooks next week around October 20, when CPC’s Three-Month Precipitation Outlooks and NOAA Winter Outlook are expected to be released.
*The years included in the selection were 1950-51, 1955-56, 1962-63, 1971-72, 1974-75, 1999-2000 and 2008-09. The base period was 1971-2000. The selection was based on the MEI.
