Category Archives: weather|el nino

Southern California Rainy Season Isn’t Over Until It’s Over

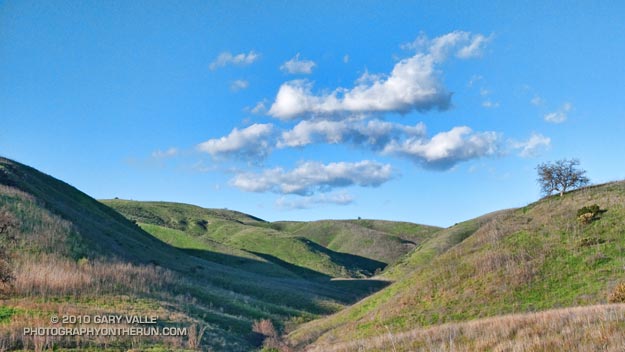
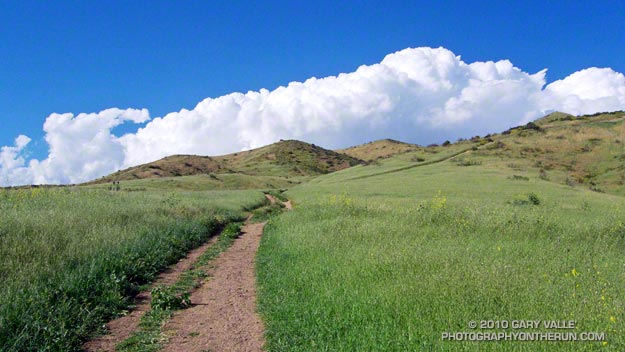
Chumash Trail Clouds

I heard a news report the other day that Southern California’s rain season would end in two weeks. While Southern California typically receives the bulk of its precipitation in the months of November through April, the rain season doesn’t turn off like a switch on May 1. There certainly can be significant rain in May, and even June.

The water year for Downtown Los Angeles (USC) is from July 1 to June 30 of the following year. So far, Downtown Los Angeles (USC) has recorded 16.17 inches of rain during the current water year. This is more than an inch above the 1971-2000 annual climate norm for Los Angeles of 15.14 inches.

Our Sunday-Monday storm put Downtown Los Angeles at 1.51 inches of rain for the month of April — well above the climate normal of 0.83 inches. The normal amount of precipitation for May is 0.31 inches, and for June is 0.06 inches. But those are just averages. On occasion we receive much more than this, and sometimes much less. On the up side, according to NWS data, in April 1965 Los Angeles recorded a total of 6.02 inches of rain. In May 1921, 3.57 inches was measured; and in June 1999 0.98 inch was recorded.

Although the current El Niño has weakened, convection is still somewhat enhanced in a broad region of the equatorial Pacific, and the MEI, ONI, and GWO indicate the continued presence of El Niño. This could result in more active Spring weather than usual, and more opportunities for rain in Southern California.

At the moment, the next opportunity for some Southern California rain looks to be next week, around Tuesday or Wednesday. We’ll see!

The title photo is from a run on the Chumash Trail at the end of March.

A Welcome Break in a Busy Rainy Season

The weather has calmed in Southern California. Medium range models are forecasting a break of about a week in what has turned out to be a very busy rain season. Over the last 90 days a precipitation pattern typical of El Niño has emerged in the western U.S. This is reflected in rainfall total for Downtown Los Angeles (USC), which is now at 13.2 inches for the water year — 4.78 inches above normal.


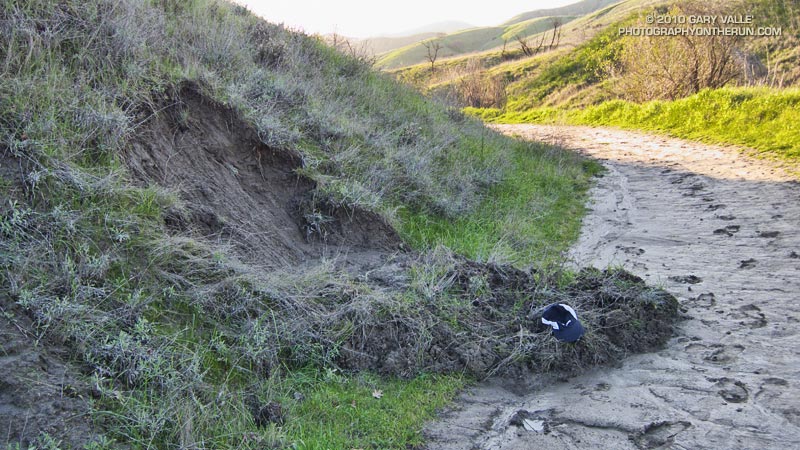
The dry weather could not have come at a better time for those affected, or threatened, by mudslides and debris flows. This small slump along a road at Ahmanson Ranch is indicative of the instability that can develop when soil becomes saturated. Had our recent wet pattern been more persistent, mudslides and debris flows might have been much more widespread and devastating.

Pattern Change Ahead

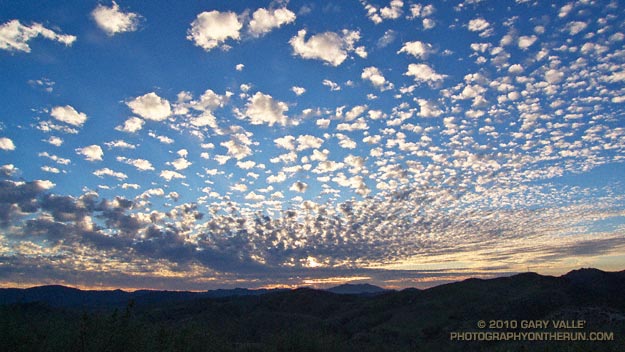
Patterned altocumulus clouds near Los Angeles

Computer models and other tools continue to forecast a shift to an “El Nino like” upper flow pattern next week that could result in an extended period of wet weather in Southern California. I’ll be updating Southern California Weather Notes on Wednesday with additional info.

The photograph of patterned altocumulus clouds is from this afternoon’s trail run along the northern boundary of Ahmanson Ranch, near Los Angeles.

Rainy Season Wildflowers and Weather

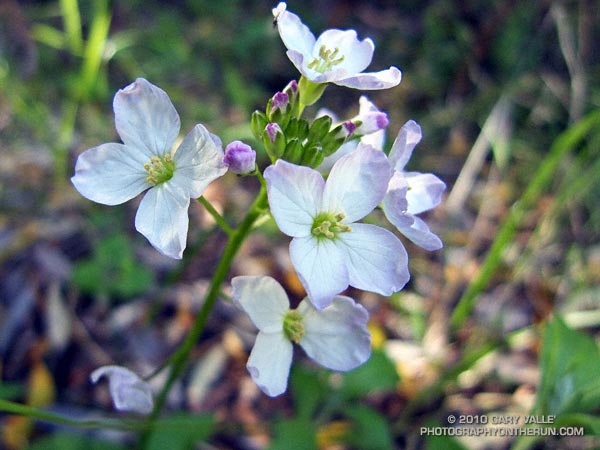
Milkmaids (Cardamine californica) along the Bulldog Motorway, in the Santa Monica Mountains.

Following the little bit of wet weather we had at the end of the year, Southern California has been enjoying idyllic weather with highs in the 70’s and 80’s. Southland cities recorded the highest temperature in the continental U.S. several days this week. Tuesday San Diego recorded a high of 84 degrees, tying Kalaeloa, Hawaii for the warmest temperature in the nation.


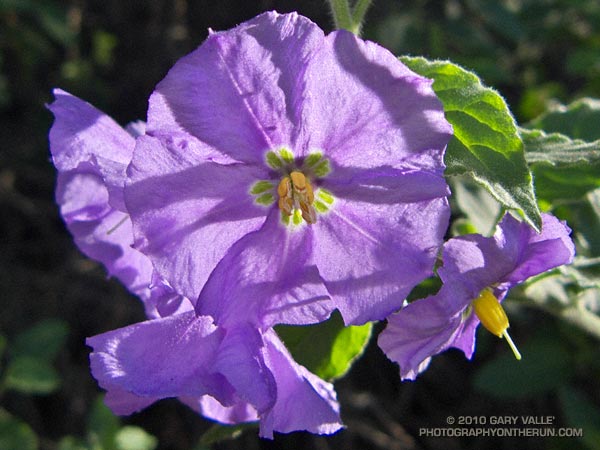
Nightshade
The weather’s been great for trail running — and for the chaparral plants. Alternating periods of wet weather and warm weather have encouraged growth and flowering, and I’ve been seeing a number of rainy season wildflowers. In addition to the milkmaids in the photograph above, some of the early bloomers include nightshade, peony, shooting star, woolly blue curls, prickly phlox, chaparral mallow, rattlesnake weed, and several others.

Rainfall totals in Southern California this rain season to date have generally ranged from an inch or so above normal to an inch or so below (WRCC). As of yesterday, Downtown Los Angeles (USC) precipitation was 0.56 inch above the norm for the water year to date. Although January has been dry so far, it looks like we may see a shift to more seasonable — and wetter — weather around midweek next week.

The precipitation pattern we’ve seen on the West Coast so far this rain season has a bit of an El Nino flavor to it, and that pattern may become better defined in the coming weeks. Today’s 6-10 day and 8-14 day precipitation outlooks from the Climate Prediction Center indicate above average rainfall for Southern California. We’ll see!

Southern California Rain and the 2009-2010 El Niño

Who would think a western Pacific typhoon could so directly affect California’s weather? But that’s what is happening. The moisture from typhoon Melor, which was over Japan just a few days ago, was captured by an extending and strengthening jet stream. This has resulted in an atmospheric river of moisture, stretching across the Pacific and into California.
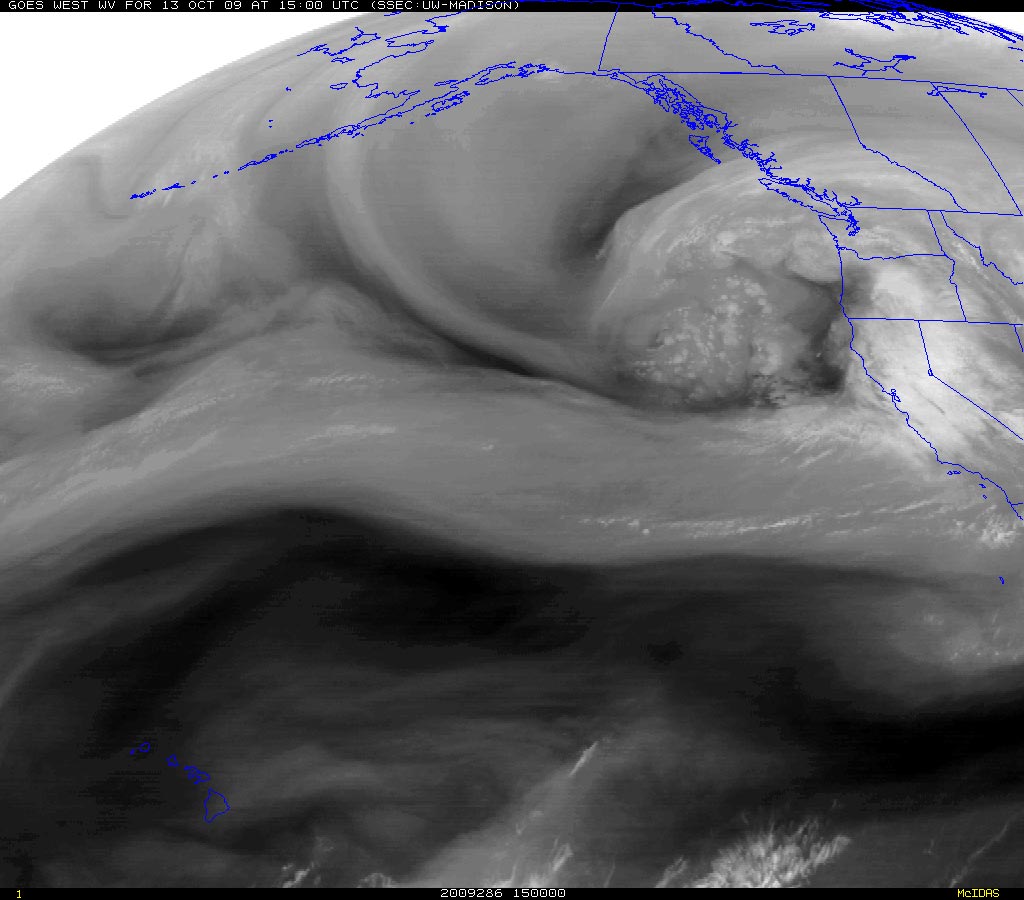


This morning, Intellicast composite radar shows Northern and Central California already being hammered by the system. Southern California has seen a few showers, and several stations have already recorded significant rainfall. As of 9:00 a.m. the CNRFC Precipitation Map shows isolated 24 hr. rainfall amounts in the foothills and mountains of Santa Barbara, Ventura, and Los Angeles County ranging from about 0.16 inch at Sandberg to 0.61 inch at West Big Pine.

The last day there was measurable rainfall at Downtown Los Angeles (USC) was on June 5, 2009, when 0.13 inch was recorded. Computer weather models forecast the best dynamics and highest rainfall totals will be in the northern two-thirds of the state, but in recent days have been trending wetter in the Los Angeles area, particularly in the mountains.

With so much moisture in the atmosphere, it takes very little lift to produce rain. Onshore winds, full of moisture, are lifted by foothills and mountains across the flow, and the result is rain — sometimes lots of it. In this case it appears the south to west facing mountains and foothills of Santa Barbara, Ventura and Los Angeles counties may record much higher rainfall totals than the lowland areas.

In a decade characterized by unusual El Ninos, the ongoing El Niño of 2009-2010 is another strange one. El Niño signals continue mixed. The Aug-Sep Multivariate ENSO Index (MEI), decreased from 0.978 to 0.754, however other El Niño signals appear to be rebounding. In the last two weeks low level equatorial westerly anomalies have increased significantly. The reduction in the strength of the trade winds, and a downwelling Kelvin wave resulting from a very strong westerly wind burst already appear to be increasing upper ocean heat content in the central equatorial Pacific. The 30 day moving Southern Oscillation Index (SOI) has been dropping, and should return to negative territory in a day or so.

Recurring equatorial westerly wind bursts and enhanced west-central Pacific convection has been slowly migrating eastward. The most recent round of enhanced convection was centered at about 160E. This is consistent with a developing El Niño, and may have contributed to the creation of the atmospheric river now affecting California, by helping to extend the Pacific jet stream following an East Asian mountain torque event.

However, total and relative AAM remain negative, and are lower than is generally the case during a developing El Niño. Of the weak to moderate El Ninos that have occurred Since 1959, only the 1977-78 and 1994-95 El Niños have had negative average July-September relative AAM values comparable to the current El Niño. Since 1959, only 4 of 15 El Niños have had negative average relative AAM values during the Southern California rain season of November to March. (Revised 12/14/09)

Moderate El Niños come in many flavors and have varying impacts. Under the guise of such El Niños Los Angeles experienced its second wettest water year on record in 2004-2005, when 37.25 inches of rain was recorded; then in 2006-2007 had its driest water year on record, when only 3.21″ was recorded. What flavor will the 2009-2010 El Niño be?

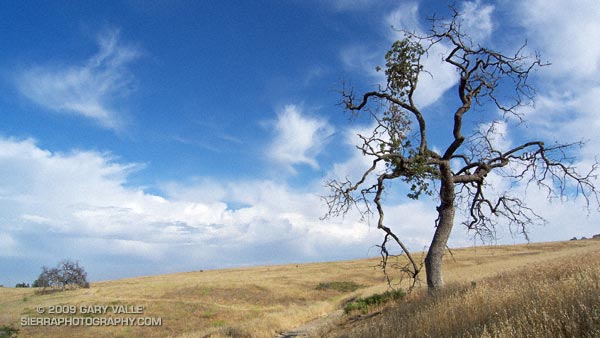
The photo of the tree and clouds is from yesterday’s run at Ahmanson Ranch.

Related post: How Does the El Nino of 2009-10 Compare to Other Warm ENSO Episodes Since 1950?
Southern California Thunderstorms an El Nino Calling Card?

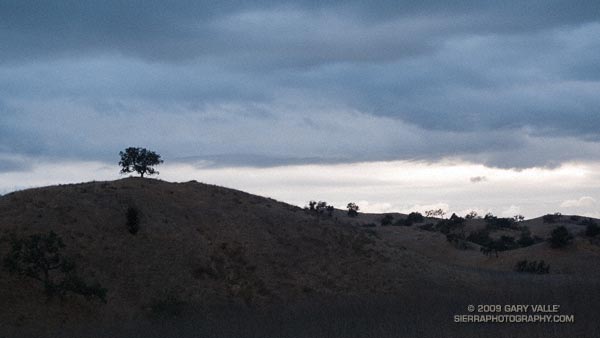
Valley oak on Lasky Mesa, with a line of thunderstorms in the distance.

Off to the south, I heard the distant rumble of thunder. The developing line of thunderstorms had swept through the West Valley about an hour before I began my run at Ahmanson Ranch.

Unusual weather for June. Not so much that there were thunderstorms, but that the thunderstorms were in part the result of an unseasonably strong jet embedded in the base of an upper level low.

It’s a bit of a stretch, but an argument could be made that these storms were a calling card of an increasingly energetic atmosphere, and a developing El Niño.

Several factors point to an increased probability of El Niño conditions developing over the next few months. Among them, Equatorial Pacific SSTs have increased, and the subsurface heat content is the highest it’s been since the El Niño of 2006-07.

But as the short-lived 2006-07 El Niño event demonstrates, an El Niño is more than just warm Pacific equatorial SSTs. Through complex forcing and feedback mechanisms, the atmosphere and oceans have to cooperate on a global scale. Generally speaking the atmosphere speeds up when there is an El Niño, and slows down during a La Nina.

And it looks like the atmosphere may be speeding up. Orbits of the Global Wind Oscillation, a measure of atmospheric momentum, have been shifting upward, in the direction of more energetic values usually associated with an El Niño.

But an El Niño is not a done deal. The climate system is just leaning in that direction. As climate scientist Klaus Wolter has pointed out, in a similar situation in 1973-1975, the climate fell back into a La Niña for another year. At this point it appears we may be diverging from that analog case. We’ll see!

Update June 6, 2009. The April-May Multivariate ENSO Index (MEI) value, released today, has increased by 0.54 to +0.34. As discussed by MEI originator, Klaus Wolter, the 3-month rise of the MEI since January-February is the 4th highest on record for this time of year, exceeded only by the strong Niño of 1997. According to Dr. Wolter, if next month’s MEI rank is at least the same as this month (37th), “it would be unprecedented for it to drop below that high-neutral ENSO-phase range by the end of 2009, virtually excluding a return to La Niña, based on the MEI record since 1950.”

Related links: ENSO Diagnostic Discussion, ENSO Wrap-Up