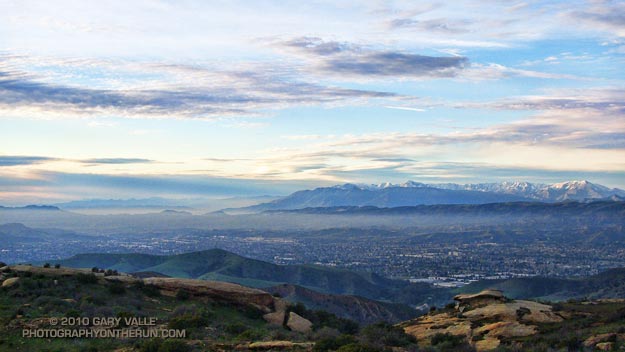
There’s snow in just about every mountain range of Southern California following last week’s series of storms. This subdued sunset view is of the Simi Valley and the Topatopa Mountains.
From this evening’s run in the Simi Hills.
There’s snow in just about every mountain range of Southern California following last week’s series of storms. This subdued sunset view is of the Simi Valley and the Topatopa Mountains.
From this evening’s run in the Simi Hills.
Computer models and other tools continue to forecast a shift to an “El Nino like” upper flow pattern next week that could result in an extended period of wet weather in Southern California. I’ll be updating Southern California Weather Notes on Wednesday with additional info.
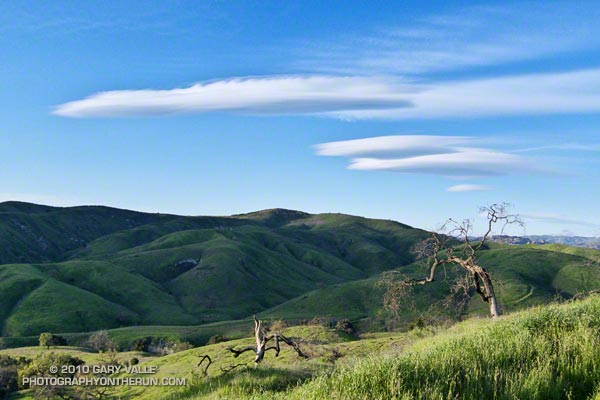
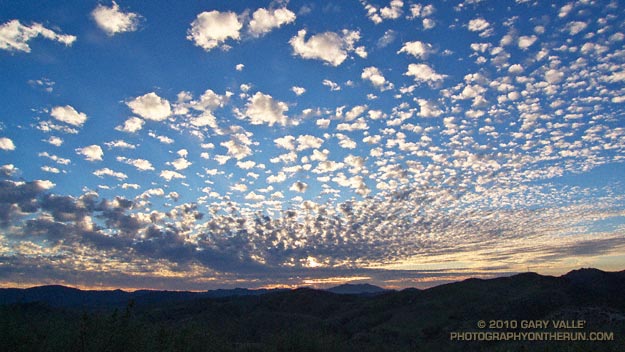
The photograph of patterned altocumulus clouds is from this afternoon’s trail run along the northern boundary of Ahmanson Ranch, near Los Angeles.
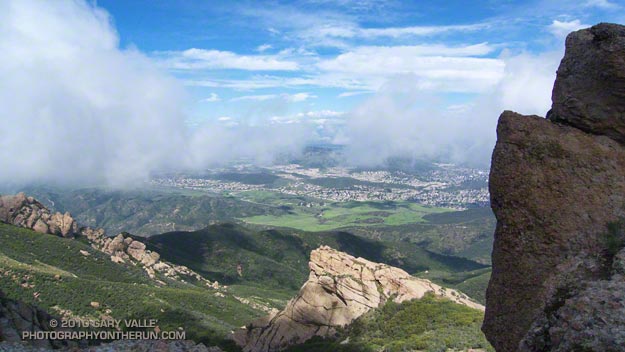
Got caught in some showers this afternoon on Rocky Peak, returning from a rambling trail run from the San Fernando Valley over into Simi Valley.
This was one of those “not sure where I’m going” runs that unfolded as it progressed. It started near Chatsworth Reservoir at Chatsworth Oaks Park, worked over to Santa Susana State Historic Park, then up the Old Stagecoach Road. At the top of the old Stagecoach Road, I picked up the Upper Stagecoach Trail and followed that to Santa Susana Pass and the 118 Frwy. From there it was a short distance down the west side of Santa Susana Pass Rd. to the Lower Stagecoach Trail, which took me to Corriganville.
Once down in Simi Valley there are four trails that ascend to Rocky Peak road, and my return route. From the shortest to the longest, they are the Wildlife Corridor trail, Hummingbird Trail, Chumash Trail and the Marrland/Las Llajas trail. Not sure how long it would take to get back to the SFV, I finally decided on the Chumash Trail.
Running up the Chumash Trail, the wind picked up, the clouds began to lower and thicken, and the temperature dropped. Minutes after turning right onto Rocky Peak road the showers began, and it wasn’t long before the sleeves came out of the pack.
The return trip, with a net elevation loss, went a little quicker than expected. Next time I’ll have to give the Las Llajas option a try. That would extend the run from about 17 miles, to something over 20. The approximate elevation gain/loss on the 17 mile version was a little under 3000 ft.
Related post: Old Santa Susana Stage Road
Some outstanding evening runs this week. Did a FiveFingers run out at Ahmanson on Tuesday, and as sometimes happens this time of year, didn’t make it back before dark. Was up on Lasky Mesa in the fading light, with endorphins at full flow. In a distant grove oaks I could hear a Great Horned Owl, and with each hoot-whoo it seemed the zeal of the day was turning to the tranquility of the night. The running was effortless and ethereal.
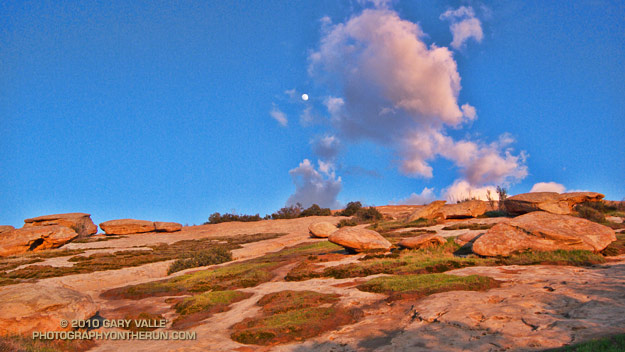
This evening’s run was also superb. Over the course of the run, the skies had become increasingly gray and troubled, as a weak cold front approached the area. Climbing a long hill, the light was dank, and I had given up on the sun. But as I neared the crest of the hill, orange-red sunlight began to illuminate the clouds from below, highlighting a sunset shower. Large, cold rain drops began to patter around me, and I watched mesmerized, as the light, clouds, and rain played on the sky.
Like flies on the sky, contrails are visually annoying, but do they also affect climate? For a discussion of the possible effects of these artificial clouds, see NOVA’s Dimming the Sun: The Contrail Effect by Peter Tyson.
From today’s run in the Simi Hills, northwest of Los Angeles.
Who would think a western Pacific typhoon could so directly affect California’s weather? But that’s what is happening. The moisture from typhoon Melor, which was over Japan just a few days ago, was captured by an extending and strengthening jet stream. This has resulted in an atmospheric river of moisture, stretching across the Pacific and into California.
This morning, Intellicast composite radar shows Northern and Central California already being hammered by the system. Southern California has seen a few showers, and several stations have already recorded significant rainfall. As of 9:00 a.m. the CNRFC Precipitation Map shows isolated 24 hr. rainfall amounts in the foothills and mountains of Santa Barbara, Ventura, and Los Angeles County ranging from about 0.16 inch at Sandberg to 0.61 inch at West Big Pine.
The last day there was measurable rainfall at Downtown Los Angeles (USC) was on June 5, 2009, when 0.13 inch was recorded. Computer weather models forecast the best dynamics and highest rainfall totals will be in the northern two-thirds of the state, but in recent days have been trending wetter in the Los Angeles area, particularly in the mountains.
With so much moisture in the atmosphere, it takes very little lift to produce rain. Onshore winds, full of moisture, are lifted by foothills and mountains across the flow, and the result is rain — sometimes lots of it. In this case it appears the south to west facing mountains and foothills of Santa Barbara, Ventura and Los Angeles counties may record much higher rainfall totals than the lowland areas.
In a decade characterized by unusual El Ninos, the ongoing El Niño of 2009-2010 is another strange one. El Niño signals continue mixed. The Aug-Sep Multivariate ENSO Index (MEI), decreased from 0.978 to 0.754, however other El Niño signals appear to be rebounding. In the last two weeks low level equatorial westerly anomalies have increased significantly. The reduction in the strength of the trade winds, and a downwelling Kelvin wave resulting from a very strong westerly wind burst already appear to be increasing upper ocean heat content in the central equatorial Pacific. The 30 day moving Southern Oscillation Index (SOI) has been dropping, and should return to negative territory in a day or so.
Recurring equatorial westerly wind bursts and enhanced west-central Pacific convection has been slowly migrating eastward. The most recent round of enhanced convection was centered at about 160E. This is consistent with a developing El Niño, and may have contributed to the creation of the atmospheric river now affecting California, by helping to extend the Pacific jet stream following an East Asian mountain torque event.
However, total and relative AAM remain negative, and are lower than is generally the case during a developing El Niño. Of the weak to moderate El Ninos that have occurred Since 1959, only the 1977-78 and 1994-95 El Niños have had negative average July-September relative AAM values comparable to the current El Niño. Since 1959, only 4 of 15 El Niños have had negative average relative AAM values during the Southern California rain season of November to March. (Revised 12/14/09)
Moderate El Niños come in many flavors and have varying impacts. Under the guise of such El Niños Los Angeles experienced its second wettest water year on record in 2004-2005, when 37.25 inches of rain was recorded; then in 2006-2007 had its driest water year on record, when only 3.21″ was recorded. What flavor will the 2009-2010 El Niño be?
The photo of the tree and clouds is from yesterday’s run at Ahmanson Ranch.
Related post: How Does the El Nino of 2009-10 Compare to Other Warm ENSO Episodes Since 1950?