Las Virgenes – Cheeseboro – Palo Comado Loop

Las Virgenes Canyon sunrise

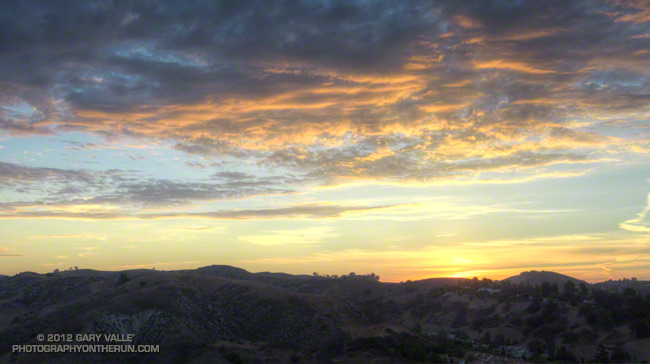
The trail was exposed and sweat was dripping from the brim of my cap like a faucet with a worn out washer. Expecting a warm day I had started my run early — before sunrise — but that had not been early enough. It was 8:30 am and the temperature was already over 90°F. It was not only hot, it was humid. Monsoon clouds were scattered across the sky, but somehow the sun was dodging all of them. It was disturbingly familiar.

Even if the weather wasn’t perfect, the run was a good one. I was doing a loop from the Las Virgenes Trailhead of Upper Las Virgenes Canyon Open Space Preserve. There are two trails here — the main trail which follows Las Virgenes Creek north up the canyon, and a power line service road (about 50 yards south of the first) that climbs out of Las Virgenes Canyon and leads west to the Cheeseboro Ridge Trail.


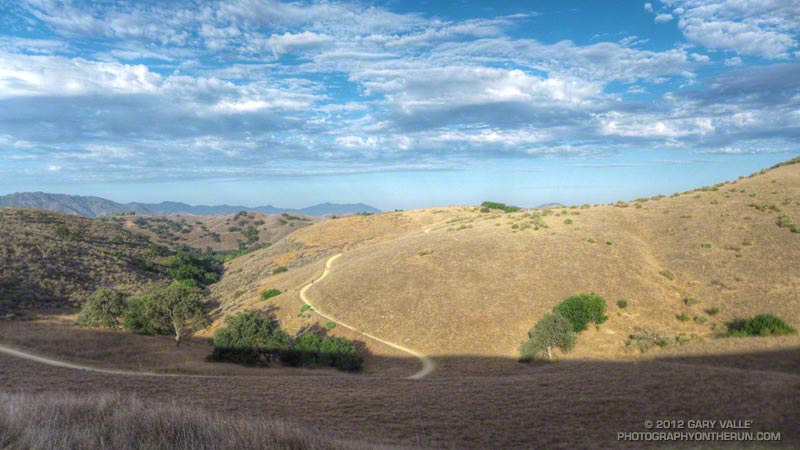
I had taken the power line service road, and worked west over to the Cheeseboro Canyon trailhead, then up the Modelo Trail and over to Palo Comado Canyon. Now I was a couple of miles up-canyon on an unmaintained, but well-used, single track trail that links the Palo Comado fire road with the Sheep Corral Trail. Once on the Sheep Corral Trail I could follow it east past Shepherds’ Flat all the way back to Las Virgenes Canyon.

There would be some relief from the heat once I reached Las Virgenes Canyon, but this was really a run better done on a cool day. On the calendar Autumn was just days away. Southern California or not, eventually the weather would cool. The development of a weak to moderate El Nino had stalled, but nearly all forecasts indicated further development was imminent. Maybe a little rain wasn’t too many weeks away.

With an elevation gain of only 1800′ over 14 miles this route includes long stretches of faster-paced trail — both single track and dirt road — but there are some good hills as well. Many variations are possible. This Park Service PDF shows the trails in the area.

Some related posts: Upper Las Virgenes Canyon – Cheeseboro Ridge Loop, Owl Feather on the Modelo Trail, Las Virgenes Creek Near the Sheep Corral Trail

What’s the Elevation Gain?

Originally posted July 31, 2009.

“What’s the elevation gain?” is a common question when talking about a trail run, because it makes such a huge difference in the difficulty of the run. A long-standing rule of thumb, Naismith’s Rule, says that the additional time required to gain 1000 ft. of elevation on a run/hike, will be the same as the time to run/hike 8000 ft. (1.5 miles) on the flat. An analysis of fell running records supports this 1 to 8 ratio.

This is not news to anyone who runs or hikes hilly trails. The first thing I check when evaluating a new race or run is the elevation gain. All the technology we have for recording and analyzing trail runs is remarkable, but it can sometimes result in wildly inaccurate claims about the elevation gain of a course.

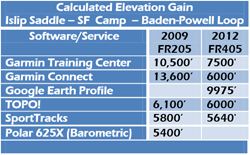
The table to the left lists the elevation gain calculated by various software and services for the the same course using GPS tracks from a Garmin Forerunner 205 and Forerunner 405. The course is the Islip Saddle – SF Campground – Mt. Baden-Powell loop in the San Gabriel Mountains.  SportTracks elevations were corrected using pkan’s Elevation Correction Plugin and SRTM elevations data in 2009 and NED 1/3 arc second DEMs in 2012. SportTracks elevation data smoothing was set to 55.

Calculations of elevation gain have improved since 2009. One reason is newer GPS chips generally produce higher quality tracks. Another is the methods used to calculate elevation gain/loss have improved and more accurate elevation datasets have become readily available and integrated into software such as SportTracks and services such as Garmin Connect.

So which of these elevation gains is the closest to reality? Fortunately, it’s fairly easy to do a low tech sanity check of these high tech results. All that is required is to get out an USGS topo map — either electronically or on paper — and do a little arithmetic.

Let’s see. From South Fork Campground (4560′) to the summit of Mt. Baden-Powell (9399′) is about 4839′. But there are a couple of small descents on the way up so we add another 240′ giving a total to the top of Mt. Baden-Powell of 5079′. It’s mostly downhill from Baden-Powell to Islip Saddle, but there are a couple of hills. The main one is a 370′ climb on the PCT up and over the shoulder of Throop Peak. There’s also another 100′ climb near Mt. Burnham, and if you stop at Little Jimmy Spring another 60′ climb. This gives a total of 5609′. Adding in a fudge factor of 100′ for very small climbs that were not included in the total and the result is a reality-checked elevation gain of about 5700′. Comparing this total to the computed elevation gains in the table, the actual gain might be as much as 6000′, but it’s not likely to be 7500′. And there’s just no way the gain is 9975′!

The title photograph is from the Momyer Trail on San Gorgonio Mountain.

Related post: Hitting the (Big) Hills of Southern California

2012 Williams Fire & Previous Fire Perimeters

Williams Fire MODIS fire detections as of 09/04/12 1745 MDT

Here’s an interactive Cesium browser View of the most recently available Williams Fire MODIS fire detections and perimeter, and perimeters for the Curve (2002), Williams (2002) and Morris (2009) fires. This is a 3D view that can be zoomed and tilted. Fire detection overlay may take a few moments to load. Placemark locations are approximate. Requires Google Earth plugin.

Snapshots:

Williams Fire MODIS fire detections as of 09/07/12 0800 MDT.

Williams Fire MODIS fire detections as of 09/06/12 0800 MDT.

Williams Fire MODIS fire detections as of 09/05/12 1615 MDT.

Williams Fire MODIS fire detections as of 09/05/12 0900 MDT.

Williams Fire MODIS fire detections as of 09/04/12 1745 MDT.

Williams Fire MODIS fire detections as of 09/04/12 0815 MDT.

Williams Fire MODIS fire detections as of 09/03/12 1600 MDT.

MODIS Google Earth fire data is from the USDA Forest Service Remote Sensing Applications Center Active Fire Mapping Program website. The 2002 Curve and 2002 Williams perimeters are from the CDF/FRAP website, and the 2012 Williams and 2009 Morris fire perimeters are from the GEOMAC website.