Category Archives: running|races

Holcomb Valley 33 Mile Trail Run 2012

Holcomb Valley 33 Mile Trail Run

When a race changes organizers sometimes you’re just not sure what you’re going to get. No worries! It seemed Tom Spiegel and Team Big Bear made every effort to maintain the quality and character of an event that for 15 years was superbly organized by Gary & Pam Kalina.

Although the temperature recorded at Fawnskin was several degrees warmer than last year the temperature on the course was cooler. Jorge Pacheco took advantage of the nearly ideal conditions and flew through the 33 mile course in a record time of 4:11:19!

Of the 118 runners that started the 33 mile this year 93 finished. Half the runners ran faster than the median time of 7:21:32 and half slower. The times for the middle third of the runners ranged from about 6:50 to 8:00.

Here’s an interactive Google Earth flyover of the Holcomb Valley 33 Mile Run that can be viewed in most browsers. (Google Earth plugin required.) Distances specified are based on my GPS traces from the past three years, and were calculated in SportTracks. Distances and placemark locations should be considered approximate. Here’s an elevation profile of the course.

Only the event director and core group of volunteers really know how much work goes into putting on an event. There are innumerable tasks that have to be coordinated and completed, and myriad (usually) minor problems that have to be resolved. The works starts months in advance of the event, and may not end for weeks after the event. The reward is in the smiles of the participants and knowing you have done the best job possible. Thank you Pam & Gary Kalina for organizing the Holcomb Valley Trail Runs for so many years.

Some related posts: Holcomb Valley 33 Mile Trail Run 2011, Holcomb Valley 33 Mile Trail Run 2010

Following are a few photos from this year’s run.


Cougar Crest View


Road Running


Horse Ranch


Leaving Aid #2


Talus on the PCT


Belleville

Perfect Weather for the 2012 XTERRA Black Mountain 15K

When the starter yelled “GO!” at the beginning of the XTERRA Black Mountain 15K I wondered if it was raining yet in the San Fernando Valley. I was not looking forward to driving home on the 405 in pouring rain. But I’d worry about that later. Here at Black Mountain Regional Park, a little north of San Diego, the weather was about as good as it gets for running.

Heavy rain was forecast later in the day and you could tell it was on the way. High clouds muted the morning sun, and a layer of threatening-looking clouds lurked on the northwestern horizon. It was cool — but not cold. After the first quarter mile I was glad I was running in short sleeves.

XTERRA SoCal Trail Run Series Distances and Elevation GainsAn email from the race organizers described the 15K course as “fairly flat” with “twists, turns and some minor hills.” I’d checked out the course profile on the trailrace.com and except for a not so minor hill at the end, the course did look pretty flat. Lots of downhill at the start, a couple of “minor” climbs in the middle of the course, and about an 8% climb over the last mile or so. A friend warned me about the hills around mile 5, so I wasn’t caught totally off guard by the steep climbs on the power line service road.

At just under a 1000′ of elevation gain, Black Mountain is the least hilly of the XTERRA SoCal Trail Run Series. But in a series noted for its climbs, flat is a relative term. To the left are the distances and elevation gains for the Series courses calculated using SportTracks* based on Garmin GPS tracks from the 2012 races, except for Malibu which is from 2011.


Here’s a more detailed Black Mountain 15K elevation profile with some notes added. Imagine running this course at an average pace of just over 6:30 min/mile! That’s what overall winner Paul Fraire did, cranking through the 9.8 mile course in 1:03:48.6. Heather Fuhr, Women’s winner and 4th overall, finished in 1:05:36.5, averaging 6:42 min/mile!

Like all the XTERRA SoCal Trail Run Series courses, the Black Mountain course was fun! There were a variety of trails and terrain, and some other interesting elements. And it’s the only race in the series that ends with a challenging climb! I really enjoyed the course.

*SportTracks elevation data smoothing set to 55. Elevations corrected using pkan’s Elevation Correction Plugin and NED 1/3 arc second DEMs.

You Ride an Elevator, but Crawl Over a Wall

The post on the XTERRA web site said the new Crystal Cove 15K course had been approved, and also mentioned something about a “gnarly” hill. I thought I better check it out, and followed a link to the course info on MapMyRun.

The elevation profile didn’t look too bad. It had the usual ups and downs you expect to see on a Southern California trail run. In Tour de France fashion, MapMyRun categorizes the more difficult climbs on a course from Cat 5 to Cat 1 with Cat 1 being more difficult.  Climbs that are crazy difficult are rated Hors catégorie (HC). A climb has to be at least 0.3 mile long to be categorized.

Two categorized climbs were noted on the MapMyRun elevation profile of the Crystal Cove 15K course: a Cat 3 that began about a half-mile into the race and climbed about 775′ over 3.4 miles, and a Cat 5 that started at about mile 4.7 and gained about 130′. The gnarly climb was supposed to be somewhere around mile 5, but the MapMyRun profile indicated that section had a grade of 2.6%??

The gnarly hill was waiting for us around a sharp corner at mile 4.75. Locals refer to it as the Elevator, but the runners I talked to call it THE WALL. Since you ride an Elevator, but have to crawl up and over a wall I’m going with THE WALL. Whatever you call the thing, it was the steepest pitch I’ve ever encountered on a race course, and steep enough that hikers often descend it on their backside. (It’s steeper than it looks in the video!)

And once you’ve clawed your way over THE WALL you’re not done — the hill continues another 0.4 mile and averages about a 15% grade. I pushed on up the climb, propelled by the thought that the MapMyRun profile showed it was nearly all downhill from around mile 5.7 to the Finish — I would have almost four miles of downhill bliss.

Or not! It was in the middle of the uphill around mile seven that I was beginning to wonder when the “good” downhill was going to begin. It had to start soon; the course was only about 9.5 miles long! After struggling to keep my pace up through a long stretch of level terrain around mile eight, I wondered — probably out loud — if the course was going to fall off the edge of the earth.


From madness comes revelation, and in this case the edge of the world. The last mile-plus of the course plummeted nearly 700 quad-numbing feet to the Finish.

Reality check: Here’s a higher resolution elevation profile generated in SportTracks using my GPS track from this year’s race. You can see there was a lot more to the course than shown in the MapMyRun profile. There are several tough climbs, ranging in grade from about 5% to 15%, and the last big hill was definitely gnarly! The course was great, and much more interesting than the MapMyRun profile suggested.

Here’s a Crystal Cove State Park Trail Map (PDF).

Whiskey Flat Trail Burger Run 2011

Kern River near the finish of the 2011 Burger Run

The Burger Run is one of those runs that is much more difficult than its 14.5 miles and 2000′ of elevation gain would suggest. For one thing the Whiskey Flat Trail ain’t no namby-pamby city trail. It’s a rustic single track trail in the Southern Sierra that runs along the Kern River from the outskirts of Kernville up to Johnny McNally’s Fairview Lodge and Restaurant — and burger stand.


The trail is single track all of the way, with so many ups and downs you’ll think you’re riding a Magic Mountain roller coaster. It seems around every corner there is another creek or a ravine. The running is varied and technical, ranging from sweet pine-needle-lined stretches of trail to gnarly, V-rutted, overgrown, rocky, sandy, steep sections that test your trail running skill.

For a time it looked like a big low moving down the coast might cause some weather problems, but overnight rain turned to partly cloudy skies race day morning, with near perfect weather for the runners and walkers.

Many thanks to race director Mike Lane, all the volunteers, McNally’s, Indian Wells Brewing Company, and all of the friendly hikers and runners. Proceeds from the race benefit Run 4 A Way, a local non-profit group dedicated to enhancing the fitness and well being of the local youth. Results and finish line photos are posted on Run 4 A Way’s Facebook page.

Here’s an interactive Cesium browser View of the Burger Run course and an elevation profile generated in SportTracks. Following are a few additional photos. Click for a larger image:


Aid Station #1


Sock’em Dog Rapid


Steep Climb


Runner, River & Road


Kern Peaks


Ten Miles In

Mt. Baldy Run (Part Way) to the Top 2011

Mt. Baldy Run to the Top Registration Area and Start

Somewhere around the junction of the 210 and 605 I saw a flash of lightning to the south. As if the flash had been a warning, a gust of wind buffeted my car, and a blizzard of dust and debris blew across the freeway. Then it started to rain. Not good — especially when you’re on your way to a race that ends on top of a 10,000′ mountain.


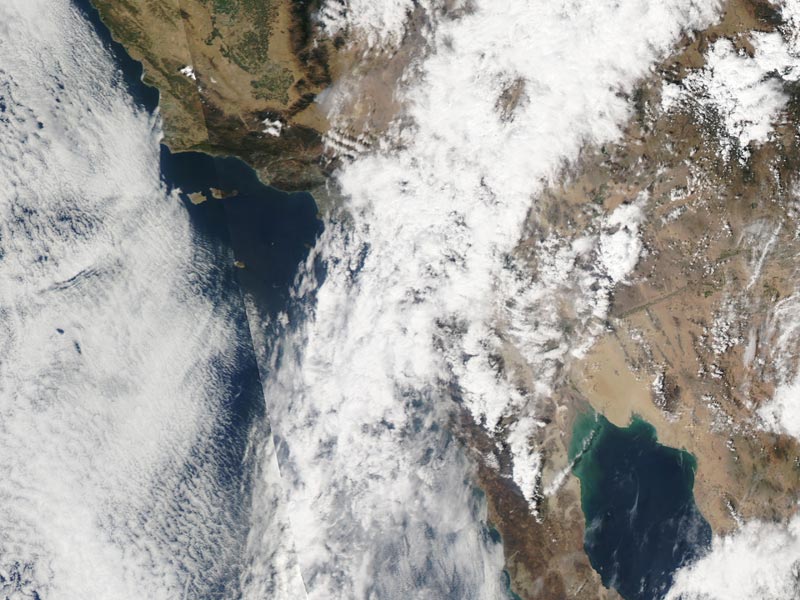
A complicated weather scenario had developed for race day. A very moist layer of monsoonal moisture had been pushed up into Southern California from Baja by a combination of a weak upper level trough off the coast and big upper level high over Four Corners. A combination of factors including an unseasonably strong jet stream had helped trigger a band of showers and thunderstorms that extended from west-southwest off the coast, across the Los Angeles basin, and into the San Gabriel Mountains.

When I drove into the Mt. Baldy Ski Lifts parking lot at around 6:45 am it was raining hard enough I didn’t want to get out of the car. Procrastinating, I went through the admittedly optimistic ritual of applying sun screen. After a few minutes the rain tapered off to sprinkles and I walked down to the Start Line to pick up my bib. The word was conditions were improving and it looked like we were going to be able to get in the race.


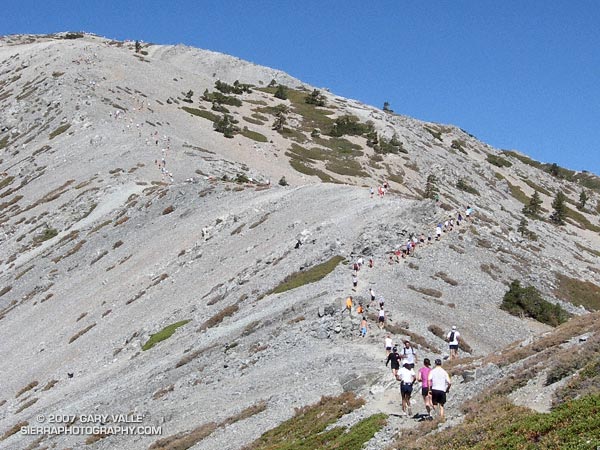
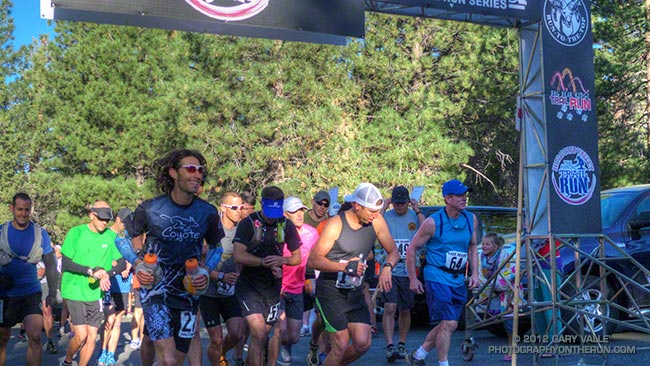
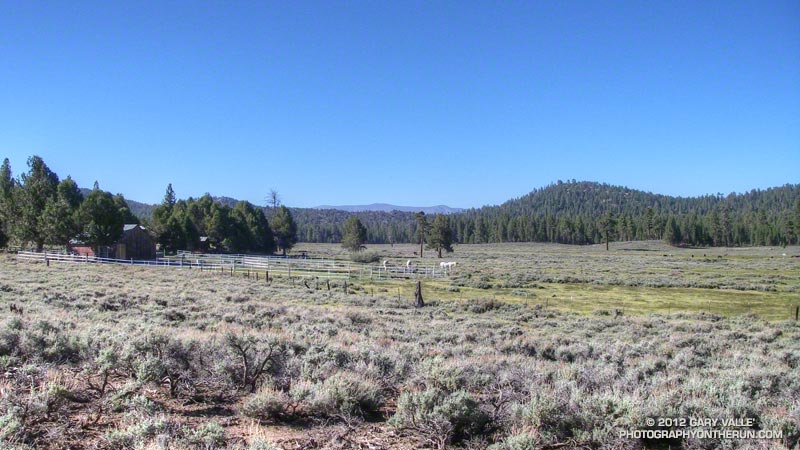
Each year the Baldy Run to the Top attracts 500 to 600 runners. Some are the best of the best and will run the seven miles and nearly 4000′ of elevation gain in under 75 minutes. About two-thirds of the runners usually finish in around 2:15 or less.. A few just want to give it a go and soon find that climbing the rough equivalent of 6500 stairs — at altitude — is more than they bargained for.

Usually the weather is pretty good — some years are a little warmer or cooler, or have a few more clouds than others, but blue skies and sunshine are the norm, and significant rain — or lightning — usually isn’t a problem.

It was deceivingly warm as runners gathered at the start line. The wind chill on top was reported to be a chilly 38 degrees. A few runners had on extra clothing, and a number of runners had an extra top or shell tied around their waste. Some had extra gear stuffed in their packs, but a few — including a couple of shirtless runners — had nothing to combat the weather.


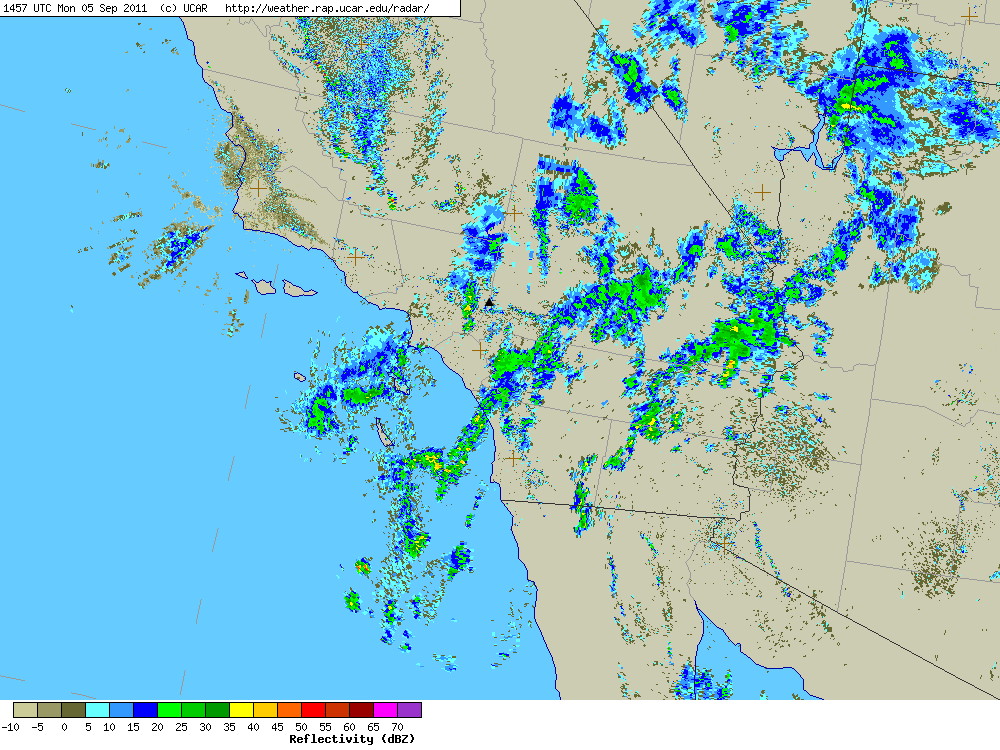
Here’s a UCAR regional NEXRAD composite radar image from about 8:00 am. The approximate location of Mt. Baldy is marked by a black triangle near the center of the image. (Note that radars in the region vary in how they show a particular area and that a cell may be stronger than indicated in the composite. Also there’s some “clutter” in the image that isn’t necessarily rain.)

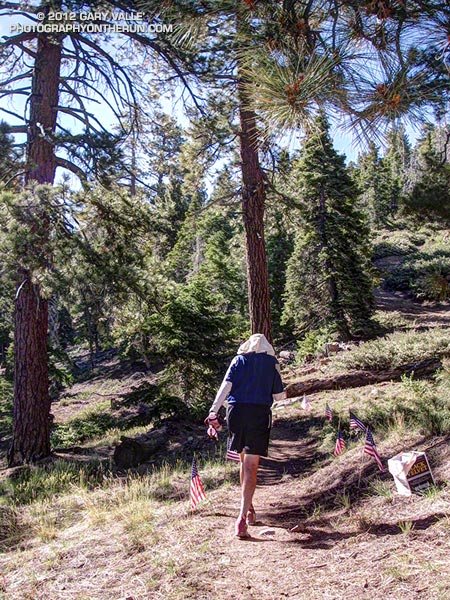
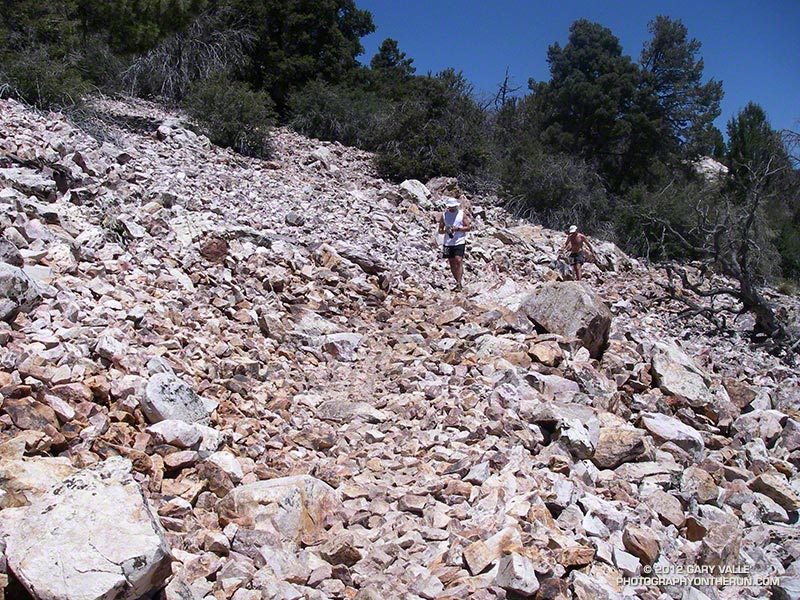
With what sounded like a more reserved “3… 2… 1… GO!” the race started and pounded down the wet pavement to Manker Flats (6160′), where it turned up the ski area service road. The (mostly) dirt road would take us to the Notch (7800′) and then the top of Chair 4 (8600′). From there a trail would take us across the exposed Devil’s Backbone, then across the south face of Mt. Harwood, and on to the final gut-wrenching 700′ climb to the summit of Mt. Baldy (10,064′). Here’s an interactive Cesium browser View of the race course.

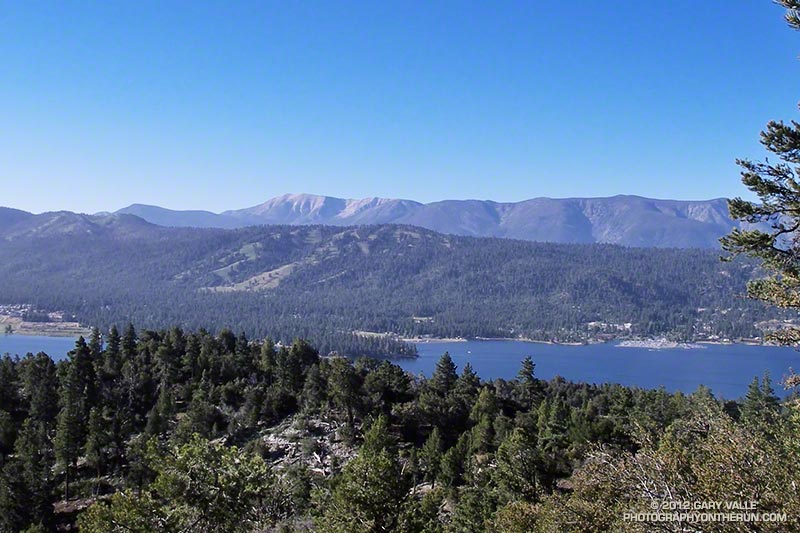
The weather on the way up to the Notch was a little unsettled, but great for running. There was a mix of clouds and sun, and even a brief shower, but overall it looked like the weather might be improving.

Just before rounding the last switchback up to the Notch, a runner with a bib was running down. This was odd because he was running well. Why would he have quit the race? Running up to the aid station at the Notch I still hadn’t caught on, and was wondering why so many people were standing around at the aid station.

That’s when I learned that about 45 minutes into the race, on the recommendation of SAR officials, the race had been shut down. I’m not sure what the “final straw” was but would guess it was nearby thunderstorms and perhaps a growing concern that rain and wind associated with a rapidly developing cell could cause serious problems for runners not prepared for inclement weather.

Here’s what a regional composite radar image looked like at around 9:00 am, and then just one hour later, as a “train” of cells about 20 miles from Mt. Baldy continued to develop and stream into the San Bernardino Mountains in the area of Silverwood Lake, Crestline and Lake Arrowhead.


Lightning was not only a risk for runners, but for the 50+ SAR and fire personnel spread across the mountain, and the 25+ volunteers that would be on top of the mountain for the duration of the event.

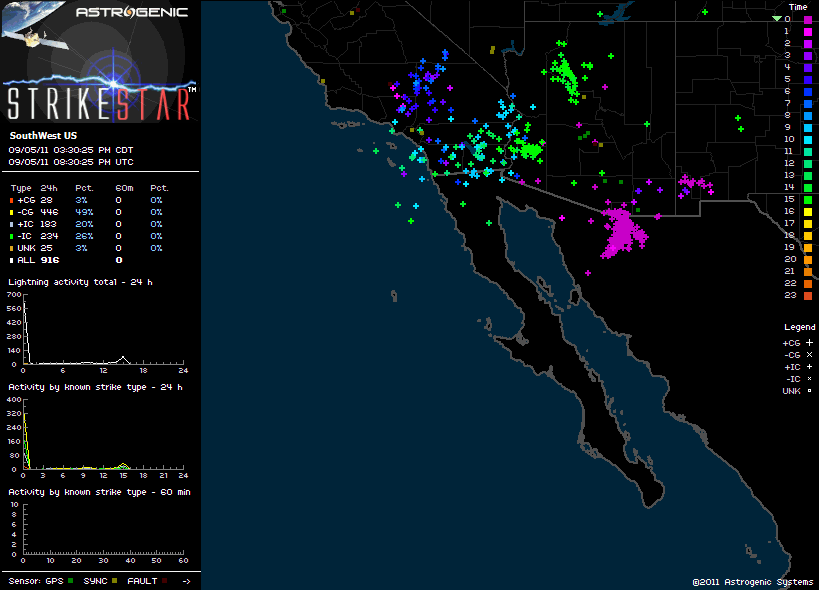
There was lightning in the area. We saw it driving to the race and I heard at least one clap of thunder while warming up before the race. Here’s an image of Astrogenic StrikeStar lightning detections in the southwestern U.S. from 10:00 pm PDT Sunday to about 1:30 pm PDT race day. Note the high percentage of cloud-ground strokes.

As this composite radar loop from WSI Intellicast.com shows, bands of showers and thunderstorms streamed into the San Gabriel and San Bernardino Mountains most of Labor Day. Cells were moving relatively rapidly and developing over a wide swath that extended from west of Mt. Baldy south and east to San Diego and Palm Springs. (Mt. Baldy is just north of ONT on the radar map.)


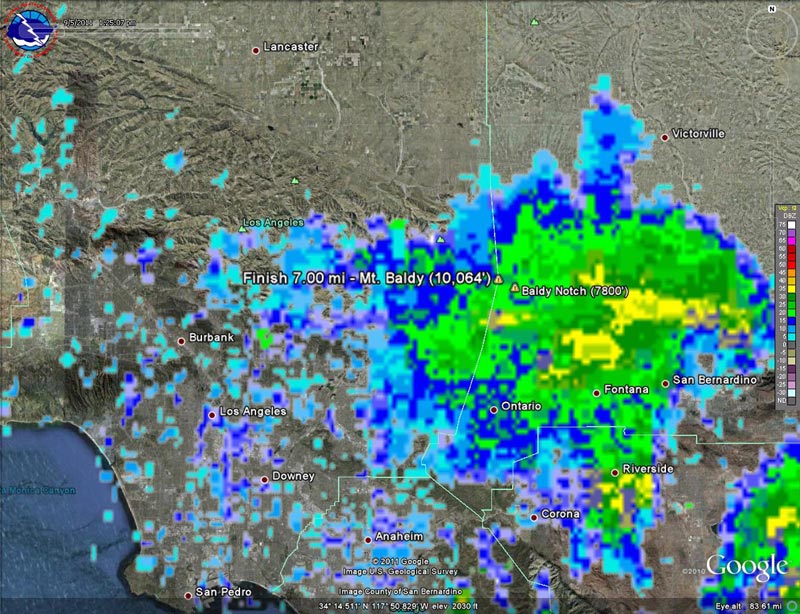
It was pretty much a crapshoot where a particular cell would develop, how strong it would be, and what its extent would be. This regional radar image shows a cell that moved into the Baldy area around 1:00 pm, and this Google Earth/NEXRAD image shows the same cell in relation to  Mt. Baldy at around 1:30 pm.

As frustrated as I was to stop at the Notch, I don’t think there’s any question that officials made the right decision when they shut down the race. And I think most runners understand that it’s not whether a particular runner was able to make it up to the summit and back down OK, but what could have happened with several hundred people on the mountain and an ever-so-slight change in that wavering stream of heavy showers and thunderstorms.

Some related posts: Thunderstorm, Mt. Baldy Run to the Top 2009, Mt. Baldy Run to the Top 2007
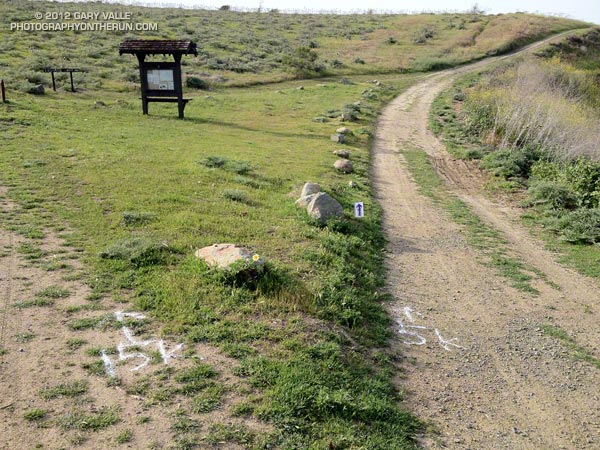
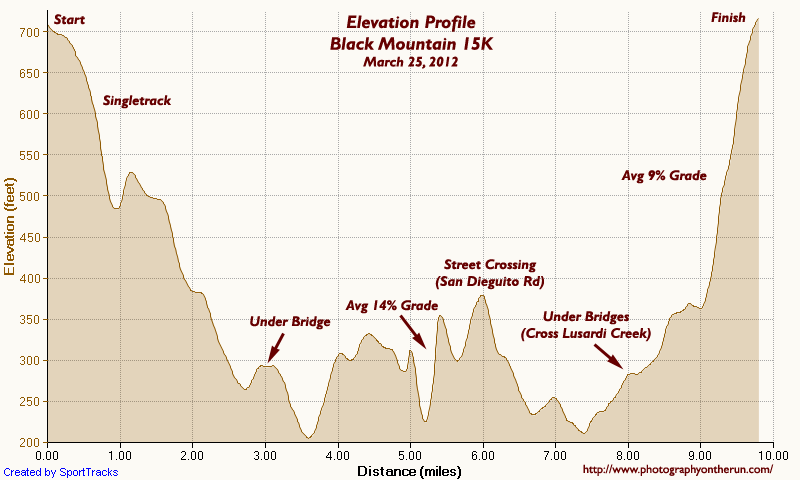
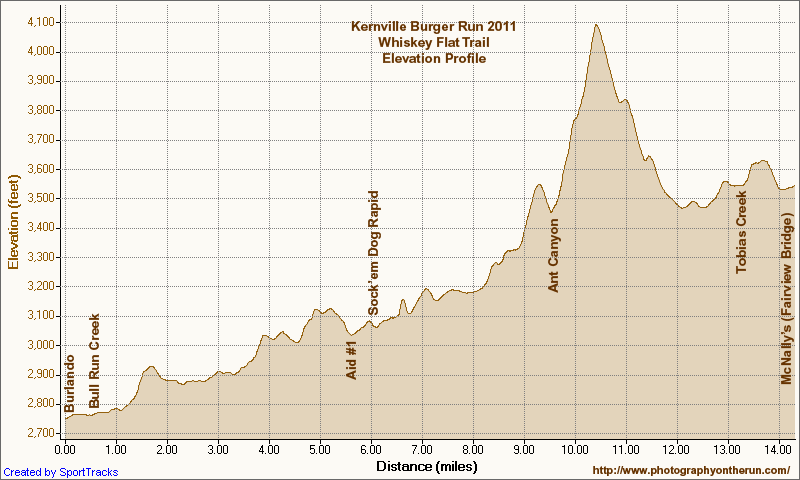
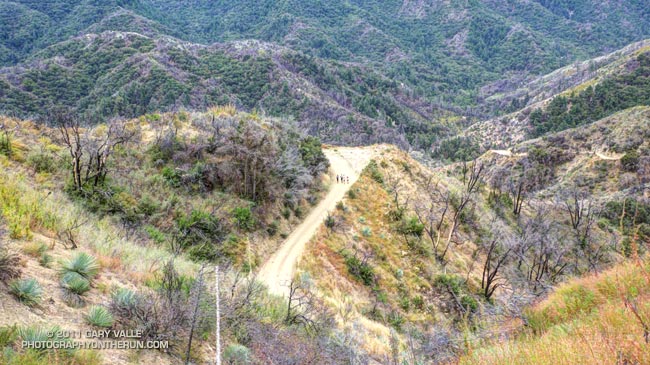
Mt. Disappointment 50K 2011 Notes

Runners on Edison Road During a Recent Training Run

Note: The Mt. Disappointment Endurance Run is now the Angeles National Forest Trail Race.

No matter if you run at the front, middle, or back of the pack, there’s the race you plan, and the race you run.

Based on the course info, it looked like the 7th edition of the Mt. Disappointment 50K was going to be more difficult than in 2009 and 2010, adding both mileage and elevation gain. Because of the closure of Mueller Tunnel and the damage done by the Station Fire and subsequent floods, we still wouldn’t be running up and over the shoulder of Mt. Disappointment, or down to Clear Creek and around Strawberry Peak, but the 2011 course would make up for that with its own very memorable sections.

To try and cope with the difficulties of the course, I’d put in extra miles and done more back to back Saturday-Sunday runs. But in one of those uh-oh moments a couple of miles into the race, I could feel in my legs that I was probably going to need to adjust my expectations. I wasn’t injured. I wasn’t getting over a cold or flu. My stomach wasn’t upset. I felt pretty good. But there was this nagging bit of fatigue in my legs…


The new wrinkle for 2011 was that we turned off Mt. Wilson Road half-way to Red Box and ran down the Valley Forge Trail. In a training run a few weeks before the race, the Valley Forge Trail had been an obstacle course overgrown with Turricula (Poodle-dog bush). Trail work by Hilliard, Rowlan & Company had restored the trail, and today it was in great shape. Here’s an interactive Cesium browser View of the 2011 course and the courses in previous years, and an elevation profile of the 2011 course.

At the bottom of the Valley Forge we turned onto the Gabrielino Trail, and started up the canyon of the West Fork toward Red Box-Rincon Road. The change in grade from level to uphill confirmed it. I stepped aside so two running friends could pass. Maybe it was a tapering or over-training issue, or maybe it was just “one of those days.” Whatever, the legs were just not cooperating.

The irony is, this was probably a good thing. The day turned out to be the hottest of any Mt. Disappointment race to date. The lurking leg fatigue forced me to not push the pace, which made dealing with the temperature easier.


And hot it was! The forecast had looked decent just two days before the race, but Friday temperatures exploded in the mountains, jumping 10-12 degrees in 24 hours. The hot temps on Friday carried over into Saturday, making race day just that much warmer.

Here are the race day temperatures at Clear Creek and Chilao for 2005-2011, and Mt. Wilson for 2009-2011. And these temps are the temperature off the ground and in the shade! A better indication of the temperature in the sun  is the “fuel temperature.” This is the temperature of a ponderosa pine dowel in direct sun. Here are plots of the race day fuel temperature at Clear Creek and Chilao for 2005-2011.


Because I wasn’t pushing the pace I didn’t hesitate to take a little extra time at aid stations. I can still feel that ice cold sponge on the back of my neck, and the cold water running down my back. This year there were numerous small stream crossings, and I think there was at least one small stream between every aid station. This was “free” cooling, and I paused a dozen times to dump water over my head. Thanks to the West Fork San Gabriel River, I was soaked from head to toe for the first steep, sun-baked section of Edison Road. This was also the case on the Silver Moccasin Trail in Shortcut Canyon and on part of Kenyon Devore.

Hot day or not there were some remarkable performances. Heather Fuhr was not only was the first place woman, she was fourth overall and set a new women’s course record of 5:07:11. Perennial favorite Jorge Pacheco sped through the tough Mt. Disappointment course in 4:46:29, winning the overall and setting a new course record in the Men’s 40-49 Division.

Once again the event was superbly organized by race director Gary Hilliard and the Mt. Disappointment 50K Staff, with the help of an extraordinary group of volunteers, runners, SAR personnel and sponsors. Thank you!

Related post: Mt. Disappointment 50K 2010 Notes