Category Archives: weather|southern california

San Gorgonio Mountain – Falls Creek Loop 2011

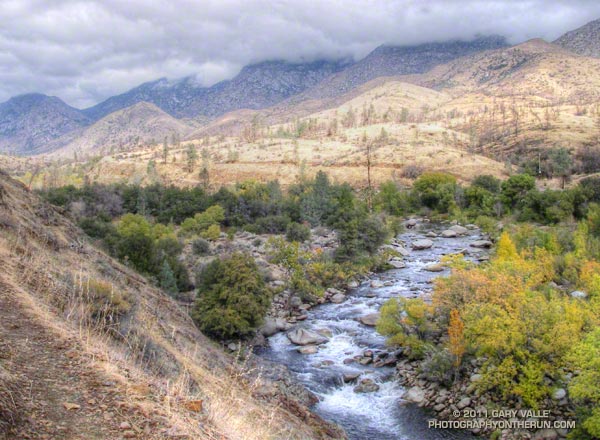
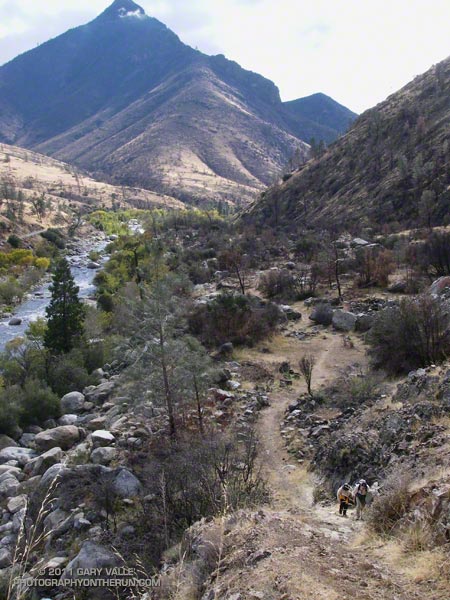
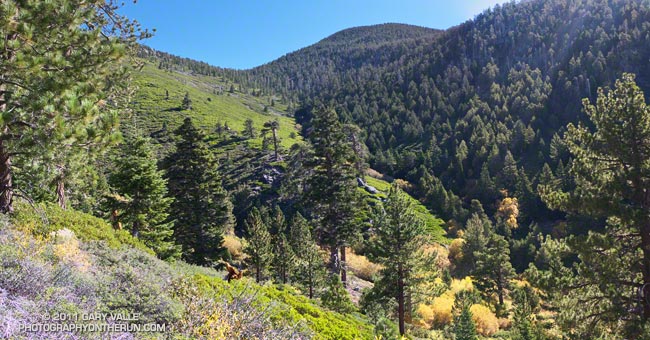
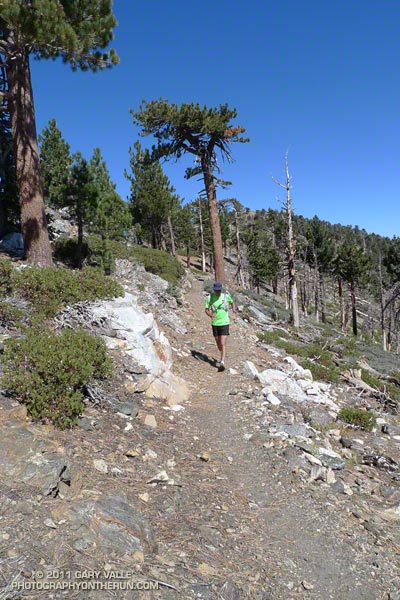
Falls Creek Trail near Plummer Meadows

I don’t say this very often, but it was great to be running on pavement — smooth, even, consistent pavement. All I had to do was put one foot in front of the other and chug on down the blacktop.

I was running down Valley of the Falls Drive from the Vivian Creek trailhead to the Momyer Creek trailhead after ascending San Gorgonio Mountain (11,499′). San Gorgonio is the highest peak in Southern California, the nearest higher peaks being Charleston Peak (11,916′) west of Las Vegas, and Olancha Peak (12,123′) in the Sierra Nevada.


The Momyer Creek and Vivian Creek trailheads are in Mill Creek Canyon, near Forest Falls, on the south side of San Gorgonio Mountain. It only takes me a few minutes longer to drive to the Momyer Trailhead than to drive to Islip Saddle in the San Gabriels, or the Chula Vista trailhead on Mt. Pinos. Momyer is another great option for a scenic, challenging, higher altitude trail run that’s relatively close to home.

There are two routes I like to do on the Forest Falls side of the mountain — the High Line and the Falls Creek loops. Both start/end at Momyer and descend via the Vivian Creek Trail.

Today I’d done the Falls Creek route. This adventurous run features 24 miles of mostly technical trail that gains and loses about 6600′ and tops out at 11,499′. It’s comparable in effort and time to a tough SoCal style 50K. The High Line route is even more of a challenge.

The day had been one of those perfect, cloudless, crystalline days you get in the Autumn, with hundred mile visibility, empyrean blue skies, rich yellow leaves, and long cold shadows.

Following last Winter’s good snowfall and runoff, and the unseasonably strong storm earlier this month, springs and streams were flowing well. On the way I stopped for water at Plummer Meadows, and on the way down at High Creek. Even though I’ve been doing adventures in the mountains for decades, it’s still a little surprising how much water is needed on a higher altitude run, especially when the humidity is low.

Recently someone asked me what kind of water filter I use with a hydration pack. I’ve used three approaches for water treatment when the water source is a “good” one and treatment is a precaution.

Updated September 19, 2017

– UV light pen. SteriPen appears to be the most widely used outdoor UV water purifying pen, and several versions are available. I’m currently using the Steripen Adventurer.
– Inline filter. Before UV pens were widely available and accepted I would occasionally use an inline filter. When dry, the filter was lightweight, however its flow rate was barely adequate. The brand I used to use is no longer available, but the Sawyer 3 Way Water Filter looks similar. Specs say it weighs 1.8 oz.
– No treatment. This is the lightest and fastest option, but having watched a climbing friend fight giardia for a year and lose a shocking amount of weight and strength, I can’t recommend it.

In the Wikipedia overview of portable water purification a writer comments that “studies have shown that UV doses at the levels provided by common portable UV units are effective at killing Giardia and that there was no evidence of repair and reactivation of the cysts.”


The range of temperatures on today’s run was extraordinary. It was cool on the summit — in the low forties — but the coldest temperature was on the shaded slopes below Dollar Lake Saddle (10,000′). Here the temperature had been a chilly thirty-something. Down in Mill Creek Canyon at the end of the run the temperature felt like it was in the mid-eighties. The Mill Creek RAWS, near the ranger station, recorded a temperature of 92 degrees  in the mid afternoon with a relative humidity of only 12%.

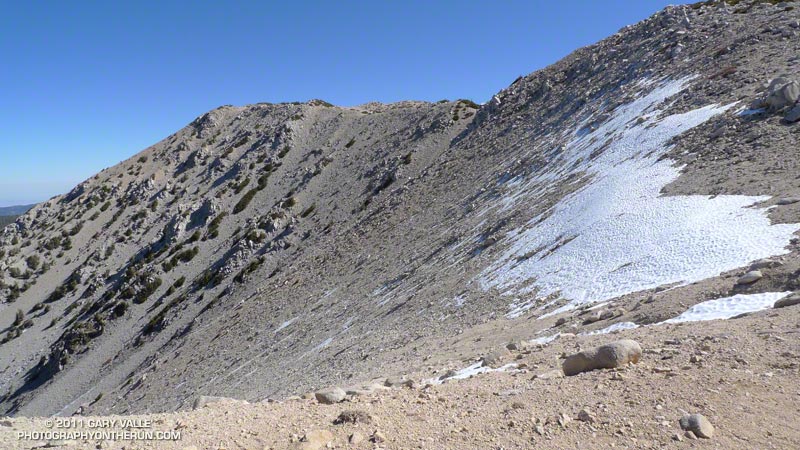
One of the highlights of today’s run is that there were still patches of snow above 10,000′ from the storm on October 5th! One big patch at 11,000′ was beginning to become sun-cupped. I don’t think I’ve seen sun-cupped new snow in Autumn before!

The title photograph is from the Falls Creek Trail near Plummer Meadows. Dollar Lake Saddle and Charlton Peak loom above.

Some related posts: San Gorgonio High Line 2009, San Gorgonio Mountain – Falls Creek Loop

La Nina and the 2011-2012 Southern California Precipitation Outlook

What a difference a week makes! Last week an unseasonably deep upper level low, unusually strong 170+ kt Pacific jet, and associated cold front combined to produce record-setting rainfall and cool temperatures in Southern California. This week high pressure and a weak offshore flow produced triple digit temperatures in some areas and set new high temperature records Wednesday in Downtown Los Angeles, Long Beach and Santa Barbara.

Which pattern is more likely this rain season? Will Southern California tend to be drier like this week, or wetter like last week and last year? Despite last year’s wet rain season, wet La Nina Winters are not the norm. Generally, La Nina conditions result in drier than normal rain seasons in Southern California, and El Nino wetter.

Following a Summer respite La Nina conditions have reemerged in the equatorial Pacific, and appear to be consolidating. Equatorial SST anomalies have continued to decrease and now range from -1.5°C at 100°W to -0.5°C at 170°E. Equatorial Pacific temperature cross sections show substantial subsurface cooling from July 11 to September 11. The Multivariate ENSO Index (MEI) has dropped from -0.5 for July/August to -0.8 for the August/September season. This drops the MEI from a rank of 16th for July/August to 13th for August/September since 1950. This is well within La Nina territory but weaker than last year’s rank of 1st for August/September.


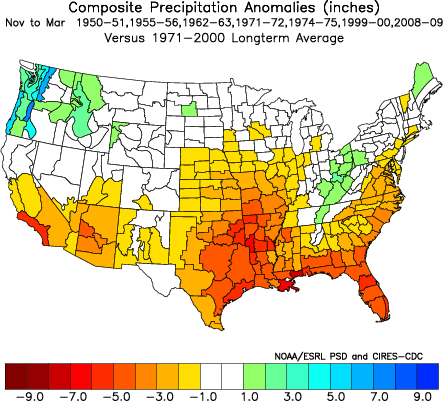
A precipitation composite for seven years* since 1950 in which La Nina conditions persisted or reemerged in the year following a first year La Nina indicates that “on average” the coastal Southern California climate division recorded about 5 to 6 inches less precipitation than normal for the period November through March. The percent of normal water year rainfall recorded at Downtown Los Angeles (USC) ranged from a low of 47% (1971, 7.17″), to a high of 106% (1955, 16.00″). The average rainfall for these years was 70.5%, or 10.7″.

We’ll get the official NOAA/CPC outlooks next week around October 20, when CPC’s Three-Month Precipitation Outlooks and NOAA Winter Outlook are expected to be released.

*The years included in the selection were 1950-51, 1955-56, 1962-63, 1971-72, 1974-75, 1999-2000 and 2008-09. The base period was 1971-2000. The selection was based on the MEI.

Inspiration Point to Islip Saddle Trail Run

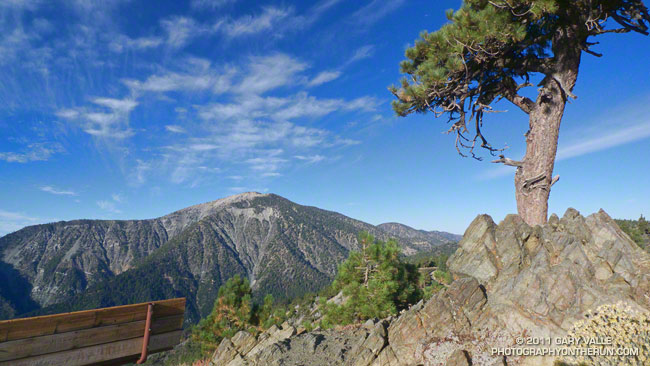
Mt. Baden-Powell from Inspiration Point

The viewpoint above is a few hundred yards up the Pacific Crest Trail from Angeles Crest Highway at Inspiration Point. Craig and I had paused near the start of our trail run from Inspiration Point to Islip Saddle to check out the view. 


The mountain across the way is Mt. Baden-Powell (9,399′).  Three miles away as the bird flies, our earthbound route along Blue Ridge, down to Vincent Gap, and then up the forty-something switchbacks to the top of the peak would total around nine miles. From the top of the peak it would be about eight miles to Islip Saddle.

Zooming in on the peak, the white arrow marks the location of the Wally Waldron Limber Pine. For more than a millennia this grand tree has stood high on this mountain, resisting the strongest of winds and the most perfect of storms. Not all are so durable. A limber pine feet away from the Wally Waldron tree was toppled in a storm last Winter.

Given the short-sleeve weather, the most unexpected discovery on today’s run was ice under the trees just up the ridge from the Wally Waldron tree. The ice had been deposited on the trees a few days before, when an unseasonably strong storm set a new rainfall record for the date in Los Angeles.

The running on the PCT between Mt. Baden-Powell and Islip Saddle was outstanding and the views superb. Along the way we did the short climb to the top of Throop Peak, checked out the Mt. Hawkins Lightning Tree, and enjoyed the cold spring water at Little Jimmy Spring.

Some related posts: Perils of Winter, Surprises of Summer; Wally Waldron Limber Pine; PCT from Inspiration Point to Islip Saddle

Mt. Baldy Run (Part Way) to the Top 2011

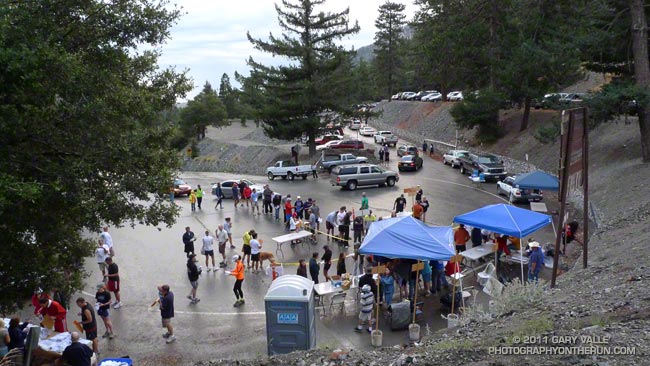
Mt. Baldy Run to the Top Registration Area and Start

Somewhere around the junction of the 210 and 605 I saw a flash of lightning to the south. As if the flash had been a warning, a gust of wind buffeted my car, and a blizzard of dust and debris blew across the freeway. Then it started to rain. Not good — especially when you’re on your way to a race that ends on top of a 10,000′ mountain.
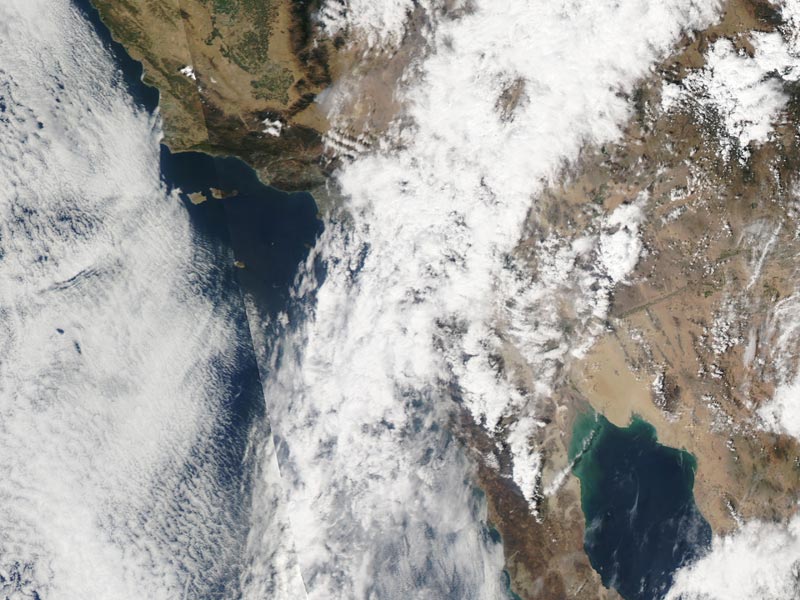


A complicated weather scenario had developed for race day. A very moist layer of monsoonal moisture had been pushed up into Southern California from Baja by a combination of a weak upper level trough off the coast and big upper level high over Four Corners. A combination of factors including an unseasonably strong jet stream had helped trigger a band of showers and thunderstorms that extended from west-southwest off the coast, across the Los Angeles basin, and into the San Gabriel Mountains.

When I drove into the Mt. Baldy Ski Lifts parking lot at around 6:45 am it was raining hard enough I didn’t want to get out of the car. Procrastinating, I went through the admittedly optimistic ritual of applying sun screen. After a few minutes the rain tapered off to sprinkles and I walked down to the Start Line to pick up my bib. The word was conditions were improving and it looked like we were going to be able to get in the race.
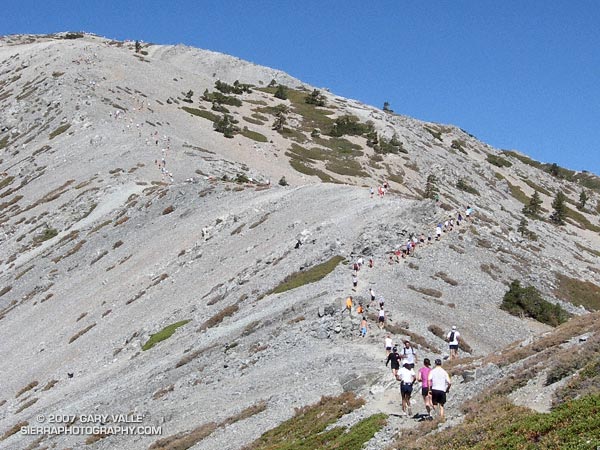


Each year the Baldy Run to the Top attracts 500 to 600 runners. Some are the best of the best and will run the seven miles and nearly 4000′ of elevation gain in under 75 minutes. About two-thirds of the runners usually finish in around 2:15 or less.. A few just want to give it a go and soon find that climbing the rough equivalent of 6500 stairs — at altitude — is more than they bargained for.

Usually the weather is pretty good — some years are a little warmer or cooler, or have a few more clouds than others, but blue skies and sunshine are the norm, and significant rain — or lightning — usually isn’t a problem.

It was deceivingly warm as runners gathered at the start line. The wind chill on top was reported to be a chilly 38 degrees. A few runners had on extra clothing, and a number of runners had an extra top or shell tied around their waste. Some had extra gear stuffed in their packs, but a few — including a couple of shirtless runners — had nothing to combat the weather.
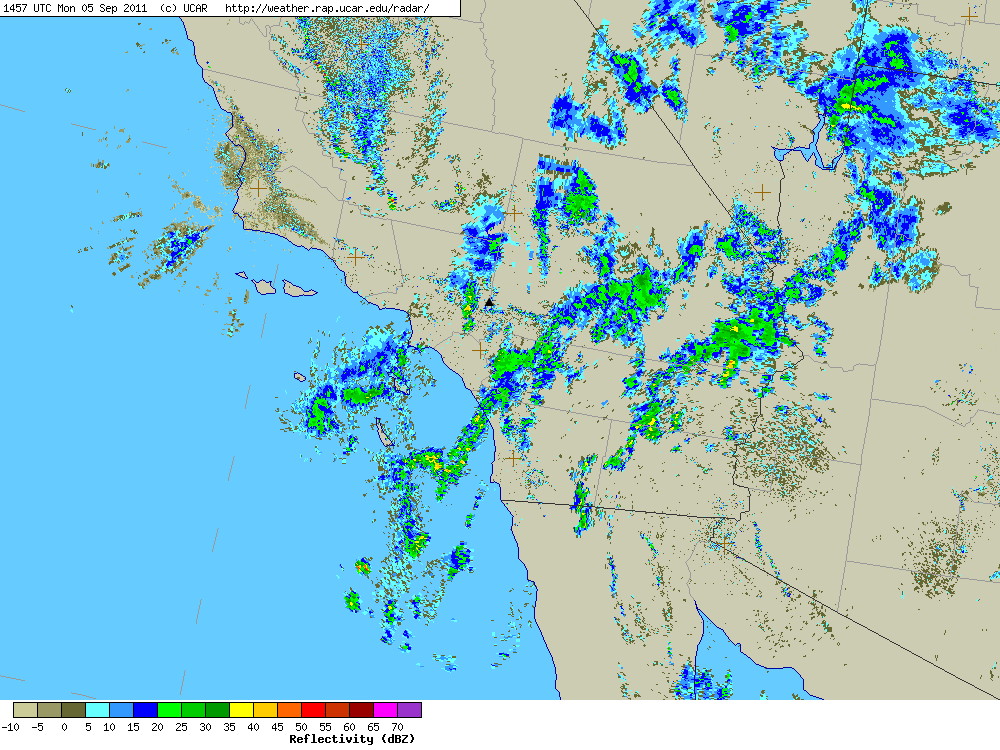


Here’s a UCAR regional NEXRAD composite radar image from about 8:00 am. The approximate location of Mt. Baldy is marked by a black triangle near the center of the image. (Note that radars in the region vary in how they show a particular area and that a cell may be stronger than indicated in the composite. Also there’s some “clutter” in the image that isn’t necessarily rain.)

With what sounded like a more reserved “3… 2… 1… GO!” the race started and pounded down the wet pavement to Manker Flats (6160′), where it turned up the ski area service road. The (mostly) dirt road would take us to the Notch (7800′) and then the top of Chair 4 (8600′). From there a trail would take us across the exposed Devil’s Backbone, then across the south face of Mt. Harwood, and on to the final gut-wrenching 700′ climb to the summit of Mt. Baldy (10,064′). Here’s an interactive Cesium browser View of the race course.

The weather on the way up to the Notch was a little unsettled, but great for running. There was a mix of clouds and sun, and even a brief shower, but overall it looked like the weather might be improving.

Just before rounding the last switchback up to the Notch, a runner with a bib was running down. This was odd because he was running well. Why would he have quit the race? Running up to the aid station at the Notch I still hadn’t caught on, and was wondering why so many people were standing around at the aid station.

That’s when I learned that about 45 minutes into the race, on the recommendation of SAR officials, the race had been shut down. I’m not sure what the “final straw” was but would guess it was nearby thunderstorms and perhaps a growing concern that rain and wind associated with a rapidly developing cell could cause serious problems for runners not prepared for inclement weather.

Here’s what a regional composite radar image looked like at around 9:00 am, and then just one hour later, as a “train” of cells about 20 miles from Mt. Baldy continued to develop and stream into the San Bernardino Mountains in the area of Silverwood Lake, Crestline and Lake Arrowhead.


Lightning was not only a risk for runners, but for the 50+ SAR and fire personnel spread across the mountain, and the 25+ volunteers that would be on top of the mountain for the duration of the event.

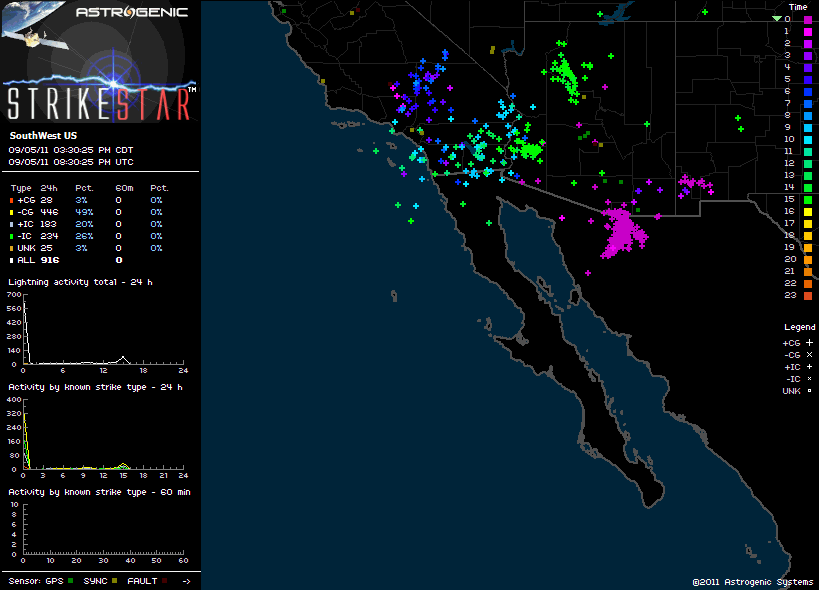
There was lightning in the area. We saw it driving to the race and I heard at least one clap of thunder while warming up before the race. Here’s an image of Astrogenic StrikeStar lightning detections in the southwestern U.S. from 10:00 pm PDT Sunday to about 1:30 pm PDT race day. Note the high percentage of cloud-ground strokes.

As this composite radar loop from WSI Intellicast.com shows, bands of showers and thunderstorms streamed into the San Gabriel and San Bernardino Mountains most of Labor Day. Cells were moving relatively rapidly and developing over a wide swath that extended from west of Mt. Baldy south and east to San Diego and Palm Springs. (Mt. Baldy is just north of ONT on the radar map.)
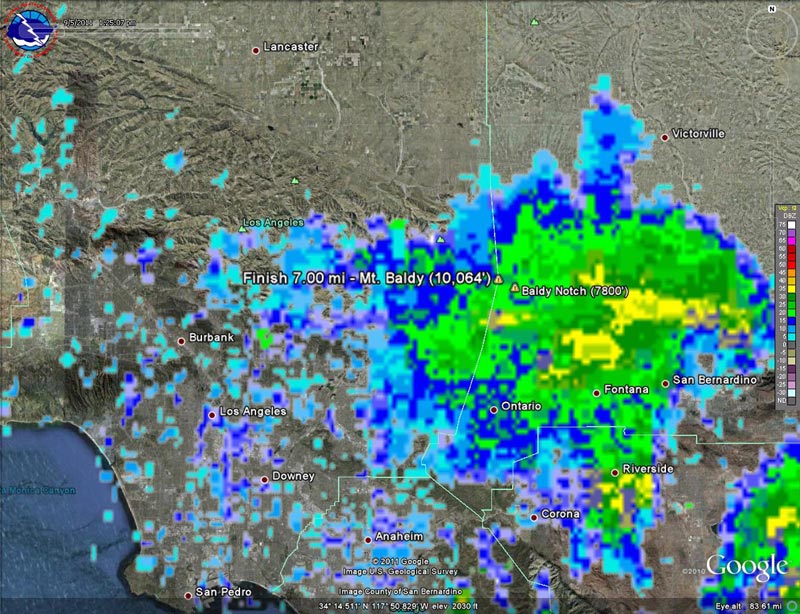


It was pretty much a crapshoot where a particular cell would develop, how strong it would be, and what its extent would be. This regional radar image shows a cell that moved into the Baldy area around 1:00 pm, and this Google Earth/NEXRAD image shows the same cell in relation to  Mt. Baldy at around 1:30 pm.

As frustrated as I was to stop at the Notch, I don’t think there’s any question that officials made the right decision when they shut down the race. And I think most runners understand that it’s not whether a particular runner was able to make it up to the summit and back down OK, but what could have happened with several hundred people on the mountain and an ever-so-slight change in that wavering stream of heavy showers and thunderstorms.

Some related posts: Thunderstorm, Mt. Baldy Run to the Top 2009, Mt. Baldy Run to the Top 2007
Mt. Disappointment 50K 2011 Notes

Runners on Edison Road During a Recent Training Run

Note: The Mt. Disappointment Endurance Run is now the Angeles National Forest Trail Race.

No matter if you run at the front, middle, or back of the pack, there’s the race you plan, and the race you run.

Based on the course info, it looked like the 7th edition of the Mt. Disappointment 50K was going to be more difficult than in 2009 and 2010, adding both mileage and elevation gain. Because of the closure of Mueller Tunnel and the damage done by the Station Fire and subsequent floods, we still wouldn’t be running up and over the shoulder of Mt. Disappointment, or down to Clear Creek and around Strawberry Peak, but the 2011 course would make up for that with its own very memorable sections.

To try and cope with the difficulties of the course, I’d put in extra miles and done more back to back Saturday-Sunday runs. But in one of those uh-oh moments a couple of miles into the race, I could feel in my legs that I was probably going to need to adjust my expectations. I wasn’t injured. I wasn’t getting over a cold or flu. My stomach wasn’t upset. I felt pretty good. But there was this nagging bit of fatigue in my legs…


The new wrinkle for 2011 was that we turned off Mt. Wilson Road half-way to Red Box and ran down the Valley Forge Trail. In a training run a few weeks before the race, the Valley Forge Trail had been an obstacle course overgrown with Turricula (Poodle-dog bush). Trail work by Hilliard, Rowlan & Company had restored the trail, and today it was in great shape. Here’s an interactive Cesium browser View of the 2011 course and the courses in previous years, and an elevation profile of the 2011 course.

At the bottom of the Valley Forge we turned onto the Gabrielino Trail, and started up the canyon of the West Fork toward Red Box-Rincon Road. The change in grade from level to uphill confirmed it. I stepped aside so two running friends could pass. Maybe it was a tapering or over-training issue, or maybe it was just “one of those days.” Whatever, the legs were just not cooperating.

The irony is, this was probably a good thing. The day turned out to be the hottest of any Mt. Disappointment race to date. The lurking leg fatigue forced me to not push the pace, which made dealing with the temperature easier.


And hot it was! The forecast had looked decent just two days before the race, but Friday temperatures exploded in the mountains, jumping 10-12 degrees in 24 hours. The hot temps on Friday carried over into Saturday, making race day just that much warmer.

Here are the race day temperatures at Clear Creek and Chilao for 2005-2011, and Mt. Wilson for 2009-2011. And these temps are the temperature off the ground and in the shade! A better indication of the temperature in the sun  is the “fuel temperature.” This is the temperature of a ponderosa pine dowel in direct sun. Here are plots of the race day fuel temperature at Clear Creek and Chilao for 2005-2011.


Because I wasn’t pushing the pace I didn’t hesitate to take a little extra time at aid stations. I can still feel that ice cold sponge on the back of my neck, and the cold water running down my back. This year there were numerous small stream crossings, and I think there was at least one small stream between every aid station. This was “free” cooling, and I paused a dozen times to dump water over my head. Thanks to the West Fork San Gabriel River, I was soaked from head to toe for the first steep, sun-baked section of Edison Road. This was also the case on the Silver Moccasin Trail in Shortcut Canyon and on part of Kenyon Devore.

Hot day or not there were some remarkable performances. Heather Fuhr was not only was the first place woman, she was fourth overall and set a new women’s course record of 5:07:11. Perennial favorite Jorge Pacheco sped through the tough Mt. Disappointment course in 4:46:29, winning the overall and setting a new course record in the Men’s 40-49 Division.

Once again the event was superbly organized by race director Gary Hilliard and the Mt. Disappointment 50K Staff, with the help of an extraordinary group of volunteers, runners, SAR personnel and sponsors. Thank you!

Related post: Mt. Disappointment 50K 2010 Notes

Mt. Disappointment 50K 2011 Training Run Part II

Descending to West Fork on the Silver Moccasin Trail

Note: The Mt. Disappointment Endurance Run is now the Angeles National Forest Trail Race.

The plan earlier in the week had been to do a day trip to the Sierra Saturday or Sunday and run the Cottonwood – New Army Pass loop, but computer models had shown a monsoonal flow developing, and a look at a satellite image Friday afternoon confirmed the forecast. Friday evening Whitney Portal was hit by a flash flood with water and mud reported up to waist deep in the campground. Runoff from the t-storms was increased by rain melting higher elevation snow, and by the ground already being wet from the prolonged melt of this year’s record-setting snowpack.


Computer forecasts indicated thunderstorms would likely continue in the mountains and deserts of Southern California through the weekend. Saturday I ran a few miles in the morning and then around lunchtime checked the weather in the Sierra. Strong thunderstorms had developed in the Southern Sierra, and a flash flood warning had been issued for the eastern slopes of the Sierra in the vicinity of Cottonwood Lakes Basin. Time to switch to plan B.

Plan B was to do a training run on the Mt. Disappointment 50K course. Mt. D is a figure-8 course, where each loop of the eight contributes about 16 miles and 3000′ or so of elevation gain/loss. Earlier this July there was a training run from Mt. Wilson on the Valley Forge – West Fork – Kenyon Devore part of the eight. Today we did another part of the figure-8 starting at Shortcut Saddle, running down the Silver Moccasin Trail to West Fork, then up to Newcomb Saddle, and then completed the loop to Shortcut on Edison Road. In the 50K, this loop would start at West Fork, but the sequence of trails would be the same.


Along with the race-ending climb up Kenyon Devore to Mt. Wilson, the climb out from the West Fork San Gabriel River to Shortcut Saddle on Edison Road is one of the more “memorable” sections of the Mt. Disappointment course. At least Kenyon Devore has some shade. Even on a blustery Spring day the 5.5 mile climb up Edison Road (2N23) can be a warm one, and in direct sun in the heat of Summer it can be downright scorching. Not so today — a layer of monsoon clouds, a fresh breeze, and an occasional drop or two of rain kept the temperature on the ascent disturbingly reasonable.

The run worked out great, but may have been a bit misleading in terms of preparing for Mt. D. It’s unlikely we’ll have a giant sun shade for the race like we did today!

Note: Weather stations on Mt. Wilson and at Clear Creek can be used to get an idea of what temperatures are running in the vicinity of the race course. Note that the temeprature specified is measured in the shade. In my experience the “fuel temperature” is a better indicator of the temperature in the sun. The fuel temperature is included in the Clear Creek listing.

Some related posts: Mt. Disappointment 50K 2011 Training Run, Mt. Disappointment 50K 2010 Notes