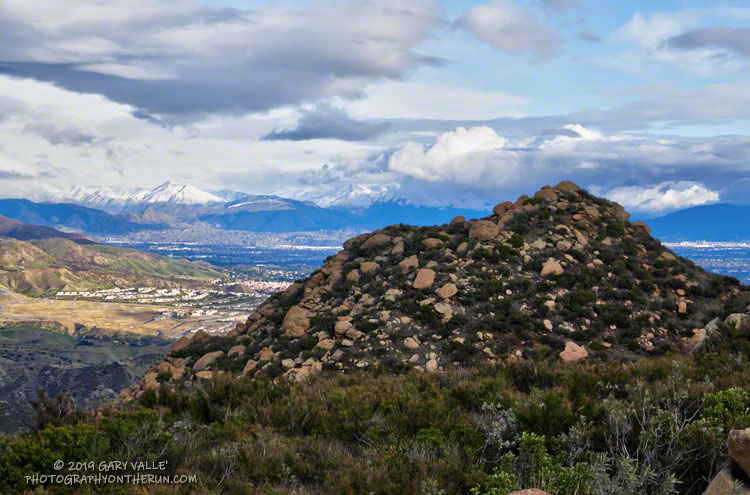
From a run and hike to the summit of Rocky Peak on March 21, before the MRCA/Santa Monica Mountain Conservancy closures.
From a run and hike to the summit of Rocky Peak on March 21, before the MRCA/Santa Monica Mountain Conservancy closures.
Following a December with twice normal rainfall, Downtown Los Angeles (USC) experienced the fourth driest January-February on record. Now it seems the spigot has been turned back on, and March rainfall for L.A. might very well be above normal.
As of 3:00 p.m. today, March 13, Downtown Los Angeles (USC) has recorded 2.05 inches of rain this March, boosting the rain year total (since July 1) to 9.40 inches. This is about 75% of normal for the date.
More rain is forecast over the next week or so, but the major weather models differ on the projected amounts. To make up for the January-February rainfall deficit and finish the rain year close to 100% of normal, Los Angeles needs another 5.5 inches of rain by June 30.
Not impossible, given some of the forecasts, but that would be a lot of rain for this time of year. Well see!
Update July 6, 2020. Remarkably, Downtown Los Angeles (USC) ended the rain year, July 1 to June 30, within 0.07 inch of normal rainfall. It was a tumultuous rain season that saw copious rainfall in December, and then almost none in January and February — usually the wettest months of the year. Just when we started to think “drought,” the wet weather returned. Combined, Match and April precipitation was 221% of normal. That and a little rain in May brought the Los Angeles rain year total up to 14.86 inches, just short of the normal of 14.93 inches.
Update April 12, 2020. Over six consecutive days, from April 5 to April 10, Downtown Los Angeles (USC) recorded 2.96 inches of rain. This is about 325% of the normal amount for the whole month. The precipitation totals of 14.66 inches for the rain year and 14.63 inches for the water year are now above normal for the date and within about one-third of an inch of the normal annual rainfall for Downtown Los Angeles.
Update April 10, 2020. April rainfall picked up right where March left off. As of April 9, Downtown Los Angeles (USC) has recorded 2.80 inches of rain this month. This is more than three times the normal amount of rain for the entire month of April. This brings the rain year and water year totals to 14.50 and 14.47 inches, respectively. For the first time since February 1 the rainfall totals for Los Angeles are above normal for the date. Los Angeles is now within a few tenths of an inch of normal rainfall for the year, and it is still raining today.
Update March 24, 2020. On March 22, Downtown Los Angeles (USC) set a new rainfall record for the date of 1.51 inches. As of March 24, Downtown Los Angeles has recorded 4.35 inches of rain this month. This is 179% of the normal amount of rain in March. The current rain year/water year total of 11.70/11.67 inches is about 88%/90% of normal for the date. The magic number for 100% of normal rainfall is 14.93 inches — either by June 30 (Rain Year) or September 30 (Water Year).
Update March 17, 2020. As of March 16, Downtown Los Angeles (USC) has recorded 2.80 inches of rain this month. This already exceeds the normal amount of rainfall for the entire month of March, which is 2.43 inches. The current rain year/water year total of 10.15/10.12 inches is about 79%/81% of normal for the date.
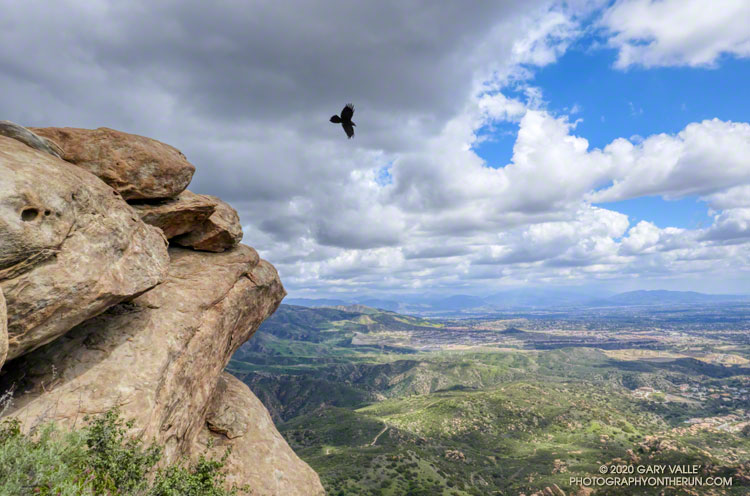
Rocky Peak Road is one of my go-to wet weather running spots. The sandy soil — thanks to the Chatsworth Formation sandstone — doesn’t cake on your shoes when it’s wet. It isn’t entirely mud-free, but as long as you don’t mind a few steep hills, it’s a good choice when the weather turns wet.
According to preliminary rainfall totals tabulated by the NWS, Rocky Peak recorded 1.22 inches of rain during the Christmas storm. The snow level had been forecast to drop to 2000′-2500′ in some areas, so as the storm was breaking up I headed over to Rocky Peak to get in a run, and see what I could see.
I’d dressed for a cool and breezy run, and was comfortable as I worked up the first steep hill. But I hadn’t run half a mile when I stopped and put on some gloves and a pair of stretch shorts. That helped, but the higher I went the colder it got. Up top, a little past Rocky Peak, my thermometer registered a chilly 38 degrees and the wind was gusting 10-15 mph. According to the NWS Wind Chill chart, that put the effective temperature at around 30 degrees.
And that’s what it felt like. Part of the problem was that I was running into the wind, which increased the chill. I had a wind shell in my pack, but once I’d reached my turnaround point and had the wind at my back, it wasn’t needed.
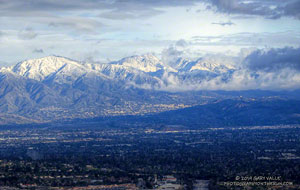
There was no snow on Rocky Peak Road or Oat Mountain, but from time to time the setting sun broke through the clouds and highlighted the snow on the nearby mountains. It was a far different scene than on the usual Rocky Peak run.
December has been wet in the Los Angeles area. As of December 27, Downtown Los Angeles (USC) has recorded 4.84 inches of rain this December, which is nearly three inches above normal. Rain year and water year precipitation totals are also well above normal, and at the moment, ahead of last year. We’ll see what the new year brings!
Update January 24, 2020. Well, the new year hasn’t brought us much in the way of precipitation. January in Downtown Los Angeles has been about as dry as December was wet. So far, Downtown Los Angeles has recorded only 0.32 inch of rain this January, well below the climate normal for the date. If there is no additional rain this month, Los Angeles will end the month with about normal rainfall to date for the Rain Year (Jul 1 – Jun 30) and Water Year (Oct 1 – Sep 30). Then we’ll have to see if there is a pattern change in February, or if it is also drier than normal, as most guidance suggests.
Related post: Snow on Oat Mountain (2008)
November 25, 2024. Updated the elevation of “Boney Point” — the high point on the northwest corner of the Boney Mountain massif — from 2935′ (DEM) to 2975′ (3DEP).
If you look at the traditional USGS 7.5 minute Triunfo Pass and Newbury Park topographic maps, BONEY MOUNTAIN refers to the large, mountainous plateau that extends roughly from Peak 2417 on the west; to Peak 2793 on the north; and to Sandstone Peak on the east. However, when people say they are climbing “Boney Mountain,” they are usually referring to a high point north of Tri Peaks, on the northwest corner of the plateau, above Newbury Park. The high point doesn’t have an official name, but in this writeup, the high point is referred to as “Boney Point.” This illustration shows these features.
Boney Point has a 3DEP elevation of about 2975′ and is typically reached by ascending the Upper Cabin Trail or Western Ridge route. When climbing to this point, most start at one of the Satwiwa trailheads, such as at Wendy Drive and Potrero Road. The high point is NOT the same as “Boney Peak,” which on recent maps is ascribed to a peak adjacent to Inspiration Point, and has an elevation of about 2825′.
Today’s running adventure ascended the Western Ridge route to Boney Point and then worked over to the Backbone Trail, by way of Tri Peaks. Part of today’s adventure was to investigate a peak near the top of the Chamberlain Trail that is labeled peak 2880 on traditional topo maps, but is labeled “Boney Mountain” on many online, GIS-based maps.
The traditional, hand-crafted USGS 7.5 minute topographic maps were produced from about 1945 to 1992, with map revisions continuing until 2006. These maps are now part of the USGS Historical Topographic Map Collection (HTMC) and still widely used. The intended replacements are the GIS-based “US Topo” maps, first released in 2012. The USGS topoView application can be used to view historical and current USGS topo maps.
The USGS “US Topo” maps are digitally produced from GIS data. As a result, some features traditionally included in USGS topographic maps — such as trails, landmarks, buildings and recreational features — may not be included. It also appears there have been some issues with geocoding placenames.
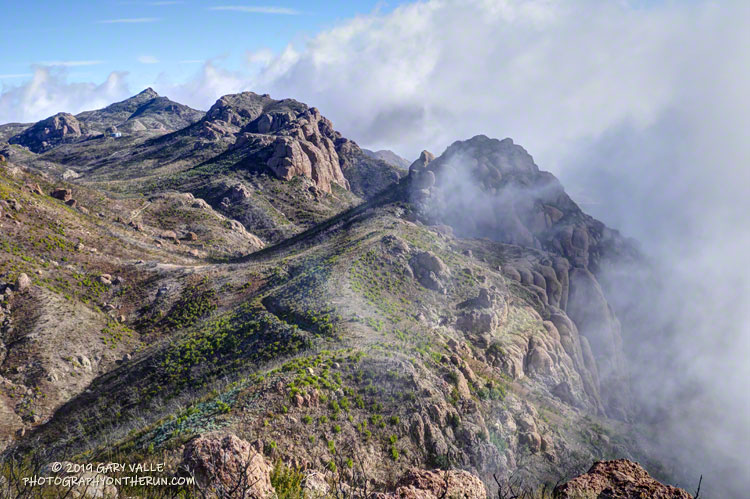
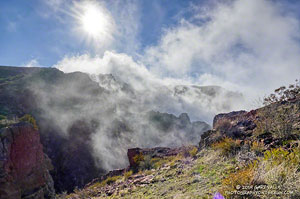
The conditions for today’s run were fantastic. Wind-driven clouds condensed along Boney Mountain’s western escarpment, spilling and tumbling over its edge in dramatic fashion.
As for the other Boney Mountain — Peak 2880 — it was brushy and the rock wasn’t the best, but climbing it did provide some fresh views of the Boney Mountain area. My guess is that the “BONEY MOUNTAIN” label, which described an area on the traditional maps, was treated like a point feature when geocoded. The nearest point happened to be Peak 2880, which speciously became “Boney Mountain.”
In the 2018 edition of the Triunfo Pass US Topo, the Boney Mountain label was moved to Tri Peaks, and the label for Tri Peaks was moved to another, unnamed, peak. In the 2019 online version of the map, the Boney Mountain label and Tri Peaks label are at Tri Peaks. Over time the maps should improve, but until then, I’ll continue to use the traditional 7.5 minute USGS maps, or commercially produced maps that have been field verified.
Here are a few photos taken on my hike and run.
Some related posts:
– After the Woolsey Fire: Boney Mountain and Pt. Mugu State
Park
– An End of Year Boney Mountain Adventure
– Looking for Boney Peak
– Looking for Boney Bluff
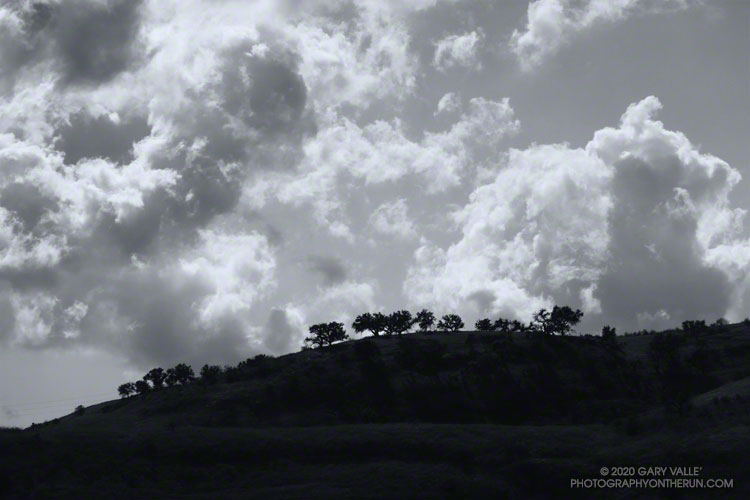
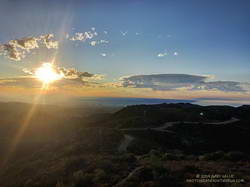
It was about 15 minutes before sunrise when I started my run from the trailhead at the “Top of Reseda.” After running up to Mulholland and partway down Fire Road #30, I could see a batch of tropical-looking clouds to the southeast. These were associated with a cutoff upper-level low that had formed off the coast of Southern California on Halloween.
The behavior of cutoff upper-level lows is difficult to forecast. They are usually separated from the general west to east flow and typically wobble around like a spinning top. A cutoff low can remain off the coast for several days or more. Just where they wobble can dramatically impact the weather. So far this morning, the only effect of this weak low had been to embellish the sunrise with a few clouds, but such lows can be capricious, and this one was no exception.
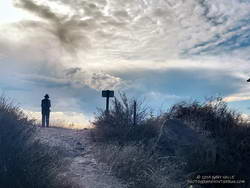
My first stop was going to be Temescal Peak, and I picked up the pace a bit, curious to see how the clouds and sunrise might look from that viewpoint. Temescal Peak is just off the Backbone Trail, near its junction with Temescal Ridge Fire Road. On a clear day this tiny peak affords an exceptional 360-degree view that can include Mt. Baldy, San Gorgonio Mountain, San Jacinto Peak, Mt. Pinos, Hines Peak, and other area landmarks.
Turning left at the Hub, it didn’t take long to get to Temescal Peak. Westward from the peak, a veil of smoke could be seen in the vicinity of the Maria Fire. Nearby, some of the canyons in the area of the Getty Fire were filled with a smoky haze. In the distance, a few mercurial clouds were scattered across the eastern sky.
At the time, I couldn’t tell if the clouds were approaching or receding, developing or dissipating. Returning to the Hub, I turned left on Eagle Springs Fire Road and began the descent toward Trippet Ranch. On the way, it became clear the clouds were headed my way. By the time I’d run to Trippet Ranch and up to the top of the Musch Trail, the band of clouds covered much of the eastern sky. Virga streamed from the bases of some of the clouds, and I wondered if a few rogue drops might be reaching the ground.
Over the remainder of the run — past Eagle Rock and through Garapito Canyon — the clouds continued to move overhead. A few drops of rain found me near the end of the run, but the most pleasant surprise occurred on the drive home, when showers dampened the streets of the western San Fernando Valley.
There had been no rain in the Los Angeles area this October, and the showers reminded me of the erratic nature of Autumn precipitation in Los Angeles. Even though “normal” rainfall in October at Downtown Los Angeles (USC) is 0.66 inch, no one familiar with L.A. weather is surprised when October is dry. Over 143 years, Downtown Los Angeles has recorded no October rainfall 26 times, 0.10 inch or less 54 times, and 0.25 inch or less 74 times.
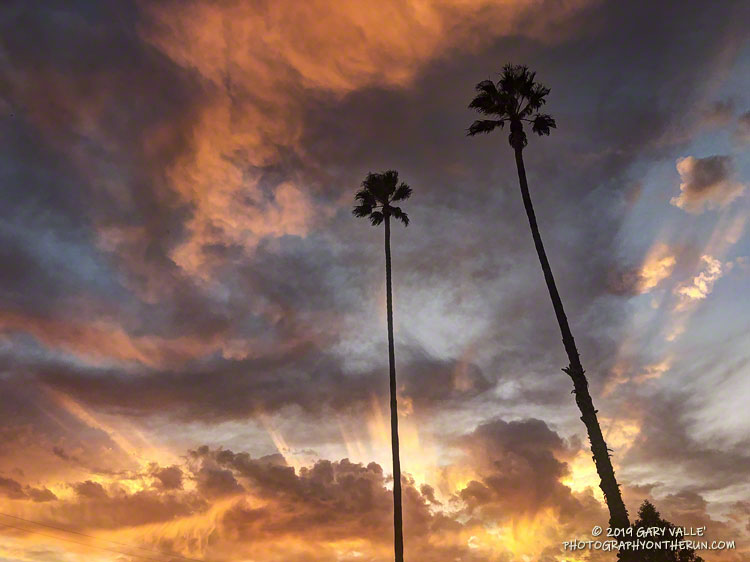
The upper-level low continued to influence the day’s weather, and while the low remained mostly offshore and didn’t generate any more showers in the West Valley, it did produce a colorful sunset!
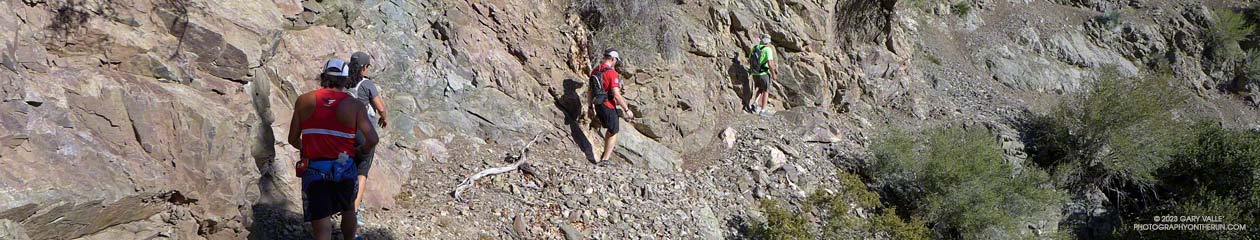
Was back on Mt. Wilson this morning, enjoying the mountains, and getting in a little more training for the upcoming Angeles National Forest Trail Run races.
There were already two cars parked in the loop road turnout when I got there, and another car pulled in behind me. All were runners.
The turnout is near the start of the ANFTR course and most of the runners were planning to do the ANFTR 25K loop or a variation. One runner — training for the ANFTR 60K and AC100 — was doing the 50K course.
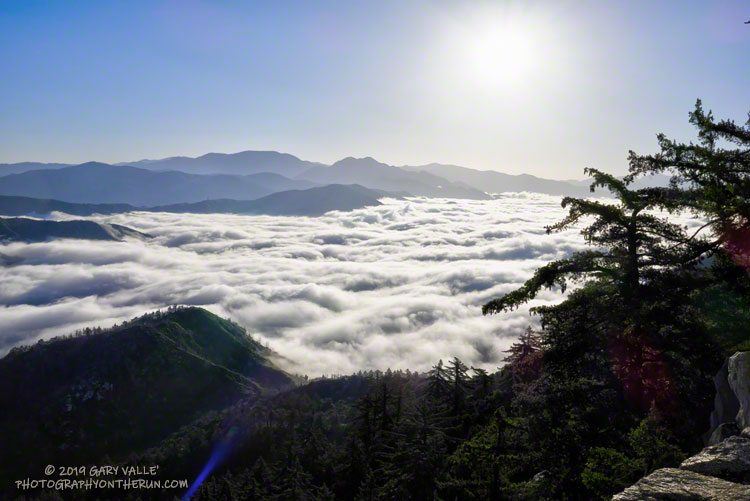
The extensive layer of low clouds in the canyons of the West Fork and East Fork San Gabriel River at the start of the run was indicative of a cool onshore flow. Too cool and comfortable, really. Anticipating warmer temperatures for the ANFTR race, I wore an extra layer for the run, and probably should have worn more.
The last two years the ANFTR races have been run during record-setting heatwaves. We’ve had a lot of cool weather this year and for a while it looked like the pleasant weather might carry over to race day, July 6. But following the finest of ANFTR/Mt. Disappointment traditions, it now looks like temps will probably be warming up for the race. Maybe not quite as hot as the last two years, but still on the toasty side. We’ll see!
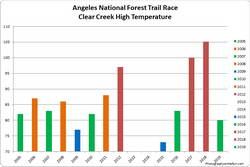
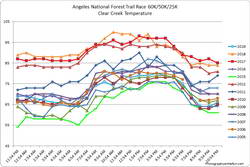
Update Thursday, July 11, 2019. As it turned out, temperatures for the 2019 edition of the Angeles National Forest Trail Run were in the “middle of the pack” compared to other years. The high temperature recorded at the Clear Creek RAWS on July 6 was 80°F. This was down 25°F from 2018. Hourly fuel temperatures at Clear Creek ranged from 101°F to 104°F between noon and 5:00 pm. The high at the Mt. Wilson RAWS on July 6 was 75°F, down 20°F from 2018.
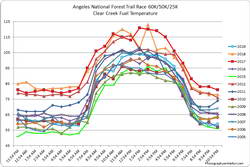
Note: The temperature in a commercial weather station is measured inside a white, ventilated instrument housing, several feet off the ground. Mid-day temperatures in the sun, in the summer, with a cloudless sky will be much warmer than this. Some stations, such as Clear Creek, also measure the fuel temperature — the temperature of a pine dowel in direct sun about a foot off the ground. According to the NWS (and common sense) exposure to full sunshine can increase heat index values by up to 15°F. In my experience the fuel temp gives a better indication of the actual temperature a runner can experience in the sun, especially on exposed mountain slopes facing the sun.
Update Monday, July 1, 2019. Last week the GFS weather model was forecasting temps on race day to be near 100 at the lower elevations and over 90 on Mt. Wilson. This morning’s GFS max temperature forecasts are down about 10 degrees from that. Basically highs in the low 90s (in the shade) for the lower elevations and around 80 at Mt. Wilson. Temps in the sun, especially on exposed sun-facing slopes, could still top 100. If the forecast holds, the temperatures today should be similar to those on race day. We’ll see! Here are links to the Clear Creek RAWS and Mt. Wilson RAWS.
Some related posts: ANFTR/Mt. Disappointment 2019, Another Scorching Angeles National Forest/Mt. Disappointment Trail Race, Record Heat for the 2017 Mt. Disappointment 50K & 25K